


Effect of Social Isolation on Serum Electrolytes and Cortisol Level in Wistar Rats
- Department of Human Physiology, Faculty of Basic Medical Sciences Nnamdi Azikiwe University, Nnewi Campus, Nigeria
Abstract
Background: Social isolation (SI) is a source of chronic stress in adults. Loneliness is, therefore, a function of the relationship quality and not quantity. This study evaluated the effect of social isolation on serum electrolytes and cortisol levels in Wistar rats.
Methods: Twenty-four Wistar rats of both sexes (12 male and 12 females) were randomly divided into four groups: Group 1 and Group 2 (as control), and Group 3 and Group 4 (experiment) with six individually caged Wistar rats each. The animals had access to food and water ad libitum , were weighed weekly and observed the level of physical activity. After six weeks of isolation, blood was collected from the animals via ocular puncture for serum cortisol, sodium, and potassium ion analysis. All data were analyzed using SPSS software version 25.0. Values were considered significant at P < 0.05.
Results: Results showed a significant decrease in mean serum sodium ion (137.78 +/- 2.9, 113.88 +/- 2.9, P = 0.004) and increase in mean calcium ion (2.74 +/- 0.24, 4.49 +/- 0.24, P = 0.003) and increase in mean serum potassium (4.92 +/- 0.29, 7.43 +/- 0.29, P = 0.003) a decrease in isolated males mean serum chloride (100.13 +/- 0.79, 93.50 +/- 0.79, P = 0.003) levels.
Conclusion: Our findings showed the social isolation for six weeks induced electrolyte imbalance in rats (below and above the physiological range).
Introduction
Social Isolation (SI) is a term that describes the absence or lack of social interactions in an individual's life. Thus, loneliness is therefore better described as a state of poor relationship quality1. According to Hawkley and Capitanio2, sociality is dependent on behaviors that either enable or impede the initiation and maintenance of a social relationship. The deficits that occur in these relationships allow researchers to evaluate or investigate how significant social interaction(s) are to the health and fitness of humans2. Also, understanding the relevance of social interactions to healthy or normal human functioning also begs the question; what happens in the absence of these interactions or relationships3. Social isolation (SI) and loneliness are known sources of chronic stress in adults4. The brain, a vital organ, is vulnerable and susceptible to alterations under genetic and environmental influences. SI is a stressor that results in modifications in reactivity to social behavior function of neuroendocrine (increases serotonin and neuropeptide Y), neurosteroids levels5, neurochemical system (decreases dopamine and noradrenaline levels), and anatomical, physiological, and behavioral changes in both animals and humans6. Research indicates that psychosocial stress is a strong independent risk factor for cardiovascular disease (CVD)7, 8. Social isolation and loneliness are risk factors for poor mental and physical health9.
Stress is defined as any condition/situation that disturbs the balance between an animal or organism and its environment. There are many stressful situations in day-to-day life, such as work pressure, examinations, psychosocial stress, and physical stress due to trauma, surgery, and various medical disorders10. The hyothalomic-pituitary-adrenal axis activation is a prominent neuroendocrine response to stress that results in the secretion of corticotrophin-releasing factor (CRF)10, 11. CRF stimulates adrenocorticotrophic hormone (ACTH), secreting cells to release ACTH into the bloodstream. ACTH acts on the adrenal cortex promoting the release of cortisol into the bloodstream Plasma levels of these hormones can increase two- to fivefold during stress11.
Electrolytes are crucial or vital minerals like sodium (Na), Chloride (Cl), and potassium (K); they are substances that become ions and conduct electricity in a solution12. Electrolytes are essential factors in several physiological processes, including fluid body volume and osmotic regulation (Na, K and Cl), myocardial rhythm and contractility, and neuromuscular excitability13, as well as acid-base balance (K, Cl) that are vital to many key functions in the body13. These electrolytes can have an imbalance, leading to either high or low levels. High or low levels of electrolytes disrupt normal bodily functions and can lead to even life-threatening complications13. However, there have been little or no reports on how social isolation affects electrolytes.
Methods
Location of the Study
This study was carried out in the Department of Physiology, College of Health Sciences, Nnamdi Azikiwe University, Nnewi Campus.
Experimental Animals
A total of twenty-four Wistar rats of both sexes (12 males and 12 females) were obtained from the animal house of the Department of Human Physiology Nnamdi Azikiwe University, weighing 120 — 150g was used for this study. They were housed in well-aerated laboratory cages, under room temperature and 12 hr light and 12hr dark cycle in the animal house of the Department of Human physiology Nnamdi Azikiwe University. They were fed with standard rat feed and distilled water ad libitum.
Ethical Approval
Ethical approval was obtained for the progress of this study from the Faculty of Basic Medical Sciences, College of Health Sciences, Nnamdi Azikiwe University, Nnewi Campus. Rats handling and treatments conform to the Nnamdi Azikiwe University Animal Research Ethics Committee (NAU-AREC) guidelines for laboratory animal care and use.
Determination of Sample Size
The sample size was determined using the resource equation method14.
Experimental Design
This study spanned for 6weeks. Animals were grouped into four groups (1, 2, 3 & 4) as follows:
-
Group 1: social male group (SMG) consisted of 6 male Wistar rats in a cage and served as control.
-
Group 2: social female group (SFG) consisted of 6 female Wistar rats in a cage and served as control.
-
Group 3: isolated male group (IMG) consisted of 6 male Wistar rats individually caged.
-
Group 4: isolated female group (ISG) consisted of 6 female Wistar rats individually caged.
Experimental Protocol
The animals were weighed once every week throughout the study. The average weight of each group was calculated, and their level of physical activity was observed. At the end of 6 weeks of isolation, the animals were sedated with chloroform, and five mL of blood was collected from the animals via ocular puncture. Afterward, serum Sodium, Potassium, Calcium, and Chloride ions were analyzed using the Ion-Selective Electrode (ISE) machine by Biobase Bioindustry Co.ltd. Model: BKE-C. Serum cortisol was assayed using the ELISA reader and ELISA cortisol kit.
Laboratory Procedure for Na, K, Caand Cl Determination
Blood samples were centrifuged at 3000 rpm for 10 mins to separate serum from plasma. Serum from centrifuged blood samples was pipetted into plain bottles.
The Probe of the already powered Ion-Selective Electrode (ISE) Machine was introduced into the serum, and then the readings for Na, k, Ca and Cl were taken.
Laboratory Procedure for Cortisol Determination
The coated wells were secured in a holder. Then 25 uL of standard, serum, and control were dispensed into the appropriate wells and thoroughly mixed gently for 10 seconds. Next, 100 uL of conjugate reagent was dispensed into each well and mixed properly; the mixture was allowed to incubate for 60 minutes at room temperature. The incubated mixture was poured out, and the microplates were rinsed five times with the buffer solution. Next, 100 uL of TMB substrate was added into each well and allowed to incubate in a dark room at room temperature for 20 minutes. Finally, 100 uL of stop solution was added to each well and gently mixed until the blue color became yellow. Optical density was read with the ELISA reader at 450 nm.
Statistical analysis
Data collected were analyzed using SPSS version 25, and the results were expressed as mean ± SEM. The statistical significance between the means was analyzed using two-way analysis of variance (ANOVA) with Turkey multiple comparison post hoc tests to determine the levels of significance between control and experimental groups. Pearson correlation was used to determine the relationship amongst variables. P-value ≤ 0.05 and r- value ≤ 0.01 were considered statistically significant.
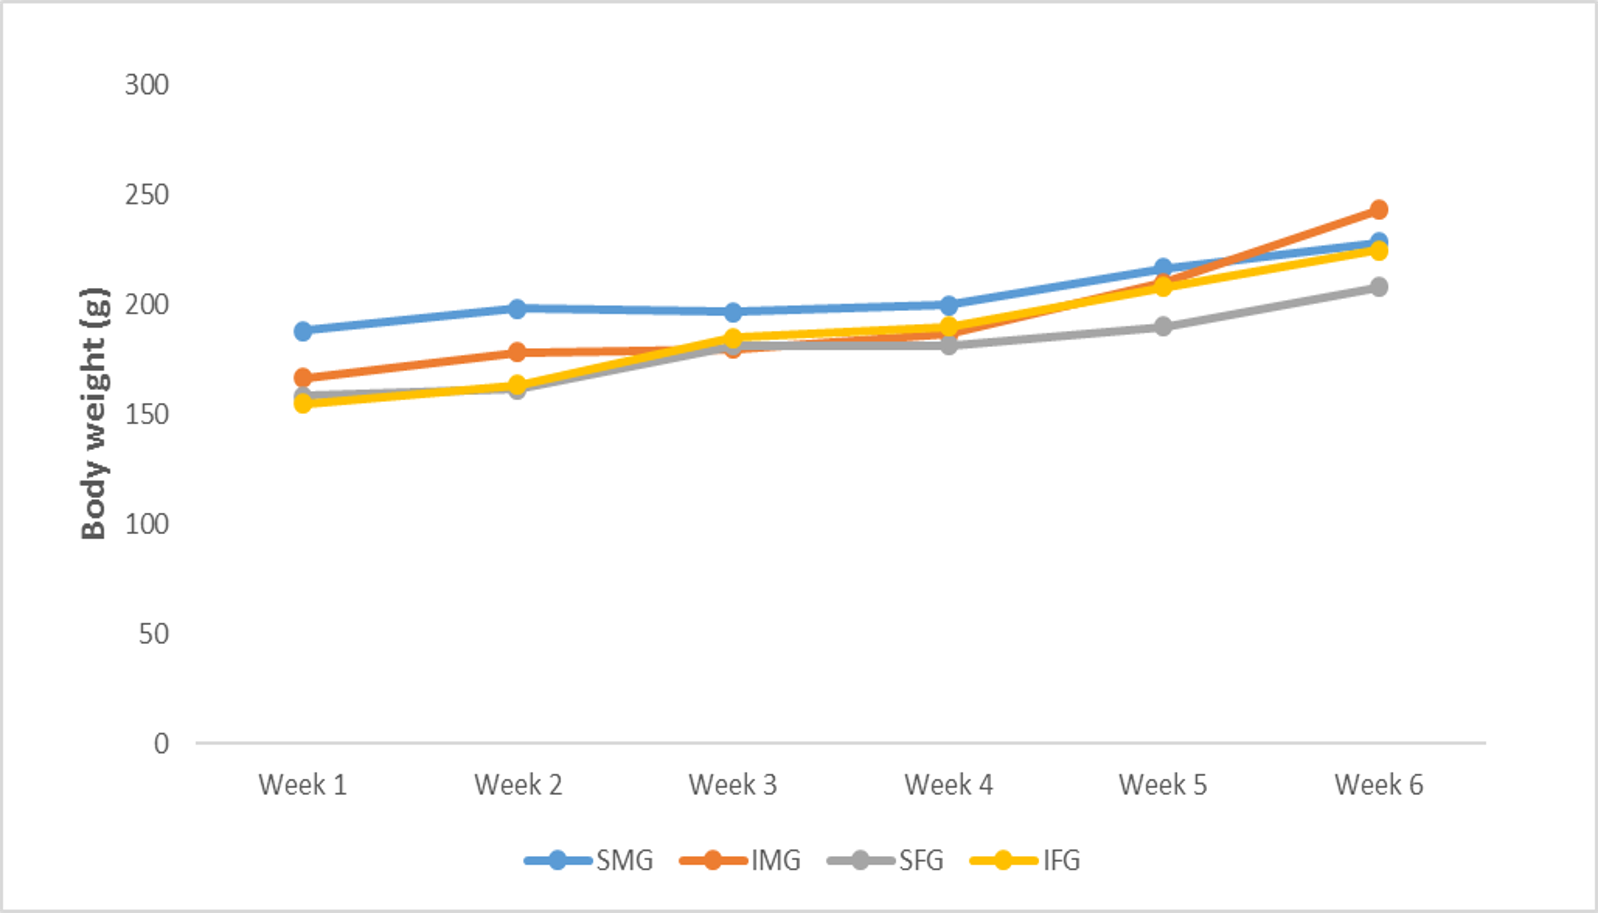
Line chart showing all groups' mean body weight changes from week 1 – 6. Figure 1 shows the changes in weight among the experimental groups across the six weeks duration of the experiment.

Figure showing the mean body weight of all groups for weeks 1, 3, and 6. Data are presented as mean ± standard error of the mean, and P-value ≤ 0.05 is considered statistically significant.

The figure showed a scattered plot of correlation between mean serum cortisol and sodium level.

The figure showed a scattered plot of correlation between mean serum cortisol and chloride level.
Table showing a comparison between mean serum electrolytes level of social males and isolated males
|
VARIABLE |
Mean ± SEM (mmol/L) |
t-value |
p-value |
|---|---|---|---|
|
Sodium (Na) |
137.78 ± 2.9 113.88 ± 2.9* |
4.46 |
0.004 |
|
Calcium (Ca) |
4.49 ± 0.24* |
- 4.87 |
0.003 |
|
Potassium (K) |
4.92 ± 0.29 7.43 ± 0.29* |
- 4.79 |
0.003 |
|
Chloride (Cl) |
100.13 ± 0.79 93.50 ± 0.79* |
4.36 |
0.005 |
Table showing the comparison between mean serum electrolytes level of social and isolated females
|
VARIABLE |
Mean ± SEM (mmol/L) |
t-value |
p-value |
|---|---|---|---|
|
Sodium (Na) |
136.65 ± 2.9 125.40 ± 2.9* |
4.93 |
0.003 |
|
Calcium (Ca) |
3.21 ± 0.24 4.69 ± 0.24* |
- 4.67 |
0.003 |
|
Potassium (K) |
5.77 ± 0.29 3.56 ± 0.29 |
0.44 |
0.674 |
|
Chloride (Cl) |
98.50 ± 0.79 100.33 ± 0.79 |
- 4.22 |
0.006 |
Showing the comparisons between mean serum cortisol level of social and isolated males and between social and isolated females
|
Parameter |
Group |
Mean ± SEM (ng/ml) |
t-value |
p-value |
|---|---|---|---|---|
|
Cortisol |
Social Male |
32.25 ± 0.81 |
- 1.08 |
0.321 |
|
Isolated Male |
33.82 ± 0.81 | |||
|
Social female |
28.69 ± 0.81 |
- 3.13 |
0.200 | |
|
Isolated Female |
30.96 ± 0.81 |
Table showing a correlation between mean bodyweight and mean serum electrolyte (Na, Ca, K, Cl) levels and mean serum cortisol level
|
W/ CORT |
W/ Ca |
W/ K |
W/Na |
W/ Cl | |
|---|---|---|---|---|---|
|
r- value |
0.148 |
0.786 |
0.014 |
0.438 |
0.005 |
|
P –value |
0.779 |
0.064 |
0.979 |
0.385 |
0.993 |
Showing correlation between mean serum Calcium level and serum Sodium, Potassium, and Chloride levels
|
Ca/K |
Ca/Na |
Ca/Cl | |
|---|---|---|---|
|
r- value |
0.372 |
-0.699** |
-0.280 |
|
P –value |
0.078 |
0.001 |
0.147 |
Showing correlation between mean serum Sodium level and serum Calcium, Potassium, and Chloride levels
|
Na/Ca |
Na/K |
Na/Cl | |
|---|---|---|---|
|
r- value |
-0.699** |
-0.628** |
0.727** |
|
P –value |
0.001 |
0.005 |
0.001 |
Showing correlation between mean serum Potassium level and serum Calcium, Sodium, and Chloride levels
|
K/Ca |
K/Na |
K/Cl | |
|---|---|---|---|
|
r- value |
0.372 |
-0.628** |
-0.794** |
|
P –value |
0.078 |
0.005 |
0.000 |
Showing correlation between mean serum Chloride level and serum Calcium, Sodium, and Potassium levels
|
Cl/Ca |
Cl/Na |
Cl/K | |
|---|---|---|---|
|
r- value |
-0.280 |
0.727** |
-0.794** |
|
P –value |
0.147 |
0.001 |
0.000 |
Showing correlation between mean serum cortisol level and serum chloride, calcium, sodium, and potassium levels
|
COR/Cl |
COR/Ca |
Na/COR | ||
|---|---|---|---|---|
|
r- value |
r = -0.451* |
r = 0.1S81 |
-0.431* |
0.331 |
|
P –value |
p = 0.040 |
p = 0.251 |
0.048 |
0.105 |
Results
Figure 1 shows the changes in weight among the experimental groups across the six weeks duration of the experiment. Figure 2 showed a significant increase in body weight (p ≤ 0.05) of the isolated males from week one (172.50 ± 7.56 g) to week six (245.00 ± 11.15 g). Figure six also showed significant increase in body weight of isolated females from week one (157.50 ± 7.56 g) to week six (220.00 ± 11.15 g).
There was a significant difference in serum sodium level in isolated males (113.88 ± 2.9 mmol/L) when compared to social males (137.78 ± 2.9 mmol/L) and a significant difference in serum calcium level in isolated males (4.49 ± 0.24 mmol/L) when compared to social males (2.73 ± 0.24 mmol/L) at P-value ≤ 0.05 (Table 1, Table 2, Table 3, Table 4). There was also a significant difference in serum chloride level in isolated males (93.50 ± 0.79 mmol/L) when compared to social males (100.13 ± 0.79 mmol/L) and a significant difference in serum potassium level in isolated males (7.43 ± 0.29 mmol/L) when compared to social males (4.92 ± 0.29 mmol/L) at P-value ≤ 0.05.
There was a significant difference in serum sodium level in isolated females (125.40 ± 2.9 mmol/L) when compared to social females (136.65 ± 2.9 mmol/L) and a significant difference in serum calcium level in isolated females (4.69 ± 0.24 mmol/L) when compared to social females (3.21 ± 0.24 mmol/L) at P-value ≤ 0.05 (Table 5, Table 6).
There was no significant difference in serum cortisol level in the isolated male's group (33.82± 0.81 ng/ml) when compared to the social male's group (32.25± 0.81 ng/ml) and isolated females group (30.96 ± 0.81 ng/ml) when compared to the social female's group (28.69 ± 0.81 ng/ml) at P-value ≤ 0.05.
There was no significant correlation between body weight and either serum electrolytes or cortisol levels (Table 4).Table 5 shows a significant negative correlation between serum calcium and sodium with r-value -0.699. Table 6shows a significant negative correlation between sodium and calcium (-0.699), sodium and potassium (-0.628), and sodium and chloride (0.727).
Table 7, Table 8, Table 9show a significant negative correlation between potassium and sodium (-0.628), potassium and chloride (-0.628), and sodium and chloride (-0.794).
Discussion
Social isolation, a source of chronic stress, has been linked to neuroendocrine, cardiovascular, and psychological disorders5, 7, 8, with little or no literature to show how social isolation affects electrolytes. Although this present study investigated the impact of social isolation on serum electrolytes and cortisol, there was no baseline measurement of serum electrolyte or cortisol level for any group. Thus, the comparison is limited to control and test groups.
The caging/housing of the animals individually was associated with an increase in aggression and agitation of Wistar rats15; this aggressive display was more in isolated males than the isolated females and was intense during the first three weeks of isolation. Also observed was an increase in the time spent attempting to escape isolation16 and a decrease in food intake compared to the socially housed groups (females and males), which also agrees with the findings15. The attempt to escape isolation was more among the female rats, while decreased food intake was more in the males during the first two weeks of isolation.
Increased feeding, accompanied by weight gain as shown in the result, was observed during the last two weeks of isolation (4 — 6 week)15. The increased food intake by the isolated rats could result from the rise in cortisol level, as earlier reported by previous studies17, 18. There was no correlation between the mean body weight of animals and any of the other variables (Na, K, Ca, Cl and Cortisol).
Stress can be chronic or acute depending on the duration and frequency, and chronic stress often results in depression9. Cortisol, commonly referred to as the stress hormone, is usually released into the bloodstream in response to stress; the increased production and circulatory concentration of cortisol have been implicated in depressive and anxiety disorders11. The reduction in physical activity and consequent depressive state of the isolated rats can be attributed to the increased cortisol level as shown in the results and agrees with earlier findings19, 20. The increase in mean serum cortisol levels of the isolated rats was not significant. Pearson correlation revealed a negative correlation between Na and Cortisol21 and between Cortisol and Cl.
Previous studies have reported Hyponatraemia as the most common electrolyte disorder recorded by clinical biochemists, and diagnosis is when the serum sodium level is below 135 mmol/L13, 20, 21. Hypernatremia has also been reported as a risk factor for mortality21. Results obtained from this study show a significant decrease in mean serum sodium level below normal physiologic range in the isolated males female (113 ± 2.9 mmol/L) and isolated female (125 ± 2.9 mmol/L), which indicates possible hyponatremia22 and likely hypotension. The decrease in sodium level might be the reason for the increased agitation, and aggression observed in the isolated rats, as earlier reported by Ana et al.15. Pearson correlation revealed a negative correlation between mean serum sodium and calcium level, mean serum sodium and potassium level, and a positive correlation between mean serum sodium and chloride level.
Potassium is mainly found inside the body cells, with a concentration in the blood between 3.5 mmo/L to 5 mmol/L23. The balance between potassium and sodium level is essential for the maintenance of normal blood pressure. Thus an imbalance in potassium concentration can result in either hypertension (decrease in potassium) or hypotension (increase in potassium). Physiologically as potassium level increases, sodium level decreases and vice versa; this is necessary for homeostasis. Results from this study showed that mean serum potassium level increased significantly in isolated males (7.43 ± 0.29 mmol/L) compared to the control (4.92 ± 0.29 mmol/L) and suggest possible Hyperkalaemia since the increase in mean serum potassium level was above the normal physiologic range (3.5 mmol/L to 5 mmol/L). This increase in serum potassium level in isolated males could result from the decrease in serum sodium level, as shown in the results. Hyperkalaemia is commonly associated with life-threatening arrhythmias24; this imbalance in potassium serum concentration could contribute to the cardiovascular disturbances induced by social isolation, as earlier reported by Xia and Li8.
Calcium is the most abundant electrolyte in the body, with a normal blood concentration range of calcium between 2.20 – 2.67 mmol/l23, a large percentage of calcium is used in bone formation23. This study revealed a significant increase in mean serum calcium level in both isolated males and females above the normal physiological range; this finding suggests that Hypercalcemia was induced by social isolation22. The increase in mean serum calcium level might have been due to the reduction in the isolated animals' physical activities, which led to the resorption of calcium from the bones. Hypercalcemia has also been closely linked to cardiac arrhythmias and cardiac arrest24, 25. This study shows that the imbalance in calcium and potassium could contribute to the mechanisms underlying social isolation-induced cardiovascular diseases, as reported by Xia and Li8. There was also a negative correlation between serum calcium and sodium level.
Chloride is the second most abundant electrolyte in the blood and has a normal physiologic range of 96 – 106 mmol/L26. This study showed a significant decrease in mean serum chloride level in isolated males, suggesting a possible Hypochloremia27 and an increase in isolated females' serum chloride level, which was not significant. This study shows that this discrepancy in chloride imbalance between the isolated males and females is unknown. Results also showed a positive correlation between sodium and chloride, negative correlations between chloride and potassium, and chloride and cortisol levels.
The mechanism via which social isolation induces these changes in serum electrolytes and cortisol levels is unknown. And this is still a preliminary study, but the present findings re-emphasize the health benefits and importance of a healthy social relationship among humans.
Conclusions
The results from this study have shown that social isolation is a source of chronic stress, which results in depression. The present findings also suggest that social isolation is a risk factor for electrolyte imbalance. The precise mechanism via which social isolation induces electrolyte imbalance is unclear. Still, from our recent findings, we can infer the following: social isolation causes stress which activates the HPA axis response and cortisol release; as the plasma concentration of cortisol increases, the plasma concentration of sodium decreases along with plasma chloride concentration. The decrease in plasma sodium level causes plasma potassium levels to rise. Furthermore, the reduction in the isolated rats' physical activities results in calcium resorption from less active bones and a consequent rise in plasma calcium concentration. This imbalance in electrolytes could be the reason for the cardiovascular malfunctions attributed to social isolation.
Recommendation
-
Further studies should be done to investigate why serum K+ levels decreased in females but increased in males following six weeks of social isolation.
-
Further studies should also be carried out to find out why serum Cl- level increased in females and decreased in males following six weeks of social isolation.
-
Further studies should also be carried out to find out the impact of social isolation serum levels of other electrolytes.
-
Further studies should also be carried out to find out if the impact of social isolation on serum levels of these electrolytes is responsible for the deregulation of reproductive functions.
Abbreviations
Ca: Calcium
Cl: Chloride
COR: Cortisol
CVD: Cardiovascular Disease
HPA: Hypothalamic-Pituitary-Adrenal Axis
ISE: Ion Selctive Electrode
K: Potassium
Na: Sodium
SI: Social Isolation
W: weight (g)
Acknowledgments
We acknowledge the support of the members of staff of the Department of Human Physiology, Nnamdi Azikiwe University Nnewi campus, Nnewi, Nigeria.
Author’s contributions
The study arose from an original idea of RIU, CSU and NNN. CSU, RIU and NNN contributed to the study's design. RIU wrote the first draft. RIU, CSU and NNN participated in experimentation and data collection; RIU, DCI and KEN carried out data analysis. Authors were involved in the preparation of the manuscript and gave their approval for the Final draft before submission. CSU and NNN supervised the entire process.
Funding
The study received no funding.
Availability of data and materials
Data that supports the findings of this study are available.
Ethics approval and consent to participate
Ethical approval was obtained for the progress of this study from the Faculty of Basic Medical Sciences, College of Health Sciences, Nnamdi Azikiwe University, Nnewi Campus (NAU/CHS/NC/FBMS/402). Rats handling and treatments conform to guidelines of the Nnamdi Azikiwe University Animal Research Ethics Committee (NAU-AREC) for laboratory animal care and use.
Consent for publication
All authors approved the final draft of the manuscript and consented to its publication.
Competing interests
Authors declare no competing interest.