

Phytochemical, Antioxidant and Toxicological Assessment of Pericopsis laxiflora (Baker) Stem bark extract in Rats
- Department of Biochemistry and Molecular Medicine, School of Medicine, University for Development Studies, Tamale, Ghana
- Department of Biochemistry and Biotechnology, College of Science, Kwame Nkrumah University of Science and Technology, Kumasi, Ghana
- Department of Pathobiology, School of Veterinary Medicine, Kwame Nkrumah University of Science and Technology, Kumasi, Ghana
- Department of Clinical Pathology, Noguchi Memorial Institute for Medical Research, College of Health Sciences, University of Ghana, Accra, Ghana
Abstract
Introduction: This study aimed to evaluate the acute and subacute toxicity of the 50 % hydroethanolic (HSE) and methanolic (MSE) extracts of Pericopsis laxiflora stem bark.
Methods: The extracts were analyzed for phytochemical constituents, 2,2-diphenyl-1-picrylhydrazyl (DPPH) radical-scavenging activity, Fourier-transform infrared (FT-IR) spectroscopy, and gas chromatography–mass spectrometry (GC–MS) using standard methods. Acute toxicity was evaluated following a single oral dose of 5000 mg/kg body weight (bw) of each extract, whereas in the subacute study the extracts were administered orally at 100, 250, and 500 mg/kg bw for 28 days, and animals were monitored for clinical signs of toxicity. Safety was assessed on the basis of body weight, organ weight, haematological and serum biochemical parameters, and histopathological examination of the liver.
Results: The extracts contained alkaloids, polyphenols, saponins, and cyanogenic glycosides and exhibited significant DPPH radical-scavenging activity. The median lethal dose (LD₅₀) exceeded 5000 mg/kg, and the subacute study revealed no significant effect on body weight, organ weight, or biochemical and haematological parameters at any dose compared with untreated animals. However, an increase in white blood cell (WBC) counts was recorded in both sexes. No significant hepatic lesions were observed on histological examination.
Conclusion: The present study demonstrates that hydroethanolic and methanolic extracts of Pericopsis laxiflora stem bark possess antioxidant activity and produce no detectable acute or subacute toxicity in male or female rats; their medicinal use therefore appears safe.
INTRODUCTION
Plant-derived pharmacological agents are utilised in all civilizations; consequently, plants have long played a critical role in healthcare systems worldwide. In some countries, notably China and India, indigenous herbal medicine constitutes a central and widely-practised therapeutic modality. These remedies are socially accepted, commercially viable, and for many populations represent the only accessible source of healthcare 1. Therefore, medicinal plants play a fundamental role in the preservation of global well-being. Traditional healers have used herbal and animal remedies since ancient times to maintain health and treat disease, and these medicines remain widespread in Africa and Asia, including Ghana. Owing to adverse side-effects and the emergence of resistance to synthetic drugs, the use of plant-derived medicines is becoming increasingly common in developed countries 2. However, recent surveys have shown that several medicinal plants can also produce adverse effects 3, raising questions about the possible harm associated with their chronic use. Accordingly, determining the toxicological effects of botanical extracts intended for therapeutic or pre-clinical application is a crucial step in safety evaluation and regulatory approval 4. Selection of herbal products is influenced by affordability, availability, and the perception that phytomedicines are less toxic than conventional medicines 5. It is important to note that plants are a major source of conventional drugs, including artemisinin, vincristine, and vinblastine, derived from Artemisia annua and Catharanthus roseus, respectively. According to the World Health Organization, nearly 80 % of the population in developing countries depends on traditional medicine for healthcare 6.
Pericopsis laxiflora is one of the most widely-used medicinal plants in Ghana, traditionally employed to treat jaundice and general debility 7. Nevertheless, information on its acute and sub-acute toxicity and antioxidant properties is limited. Studies assessing its acute and chronic hepatoprotective effects are therefore necessary to provide a scientific basis for its use. The present report describes the phytochemical composition, antioxidant activity, and toxicological assessment of P. laxiflora stem-bark hydroethanolic extract (HSE) and methanolic extract (MSE), with the aim of guiding its potential clinical application.
MATERIALS AND METHODS
Collection and authentication of plant materials
n February 2019, fresh stem bark of P. laxiflora was harvested from healthy, mature plants in the Ejura Savannah Forest Reserve, Ashanti Region, Ghana. The plant material was taxonomically authenticated at the Department of Pharmacognosy and Herbal Medicine, School of Pharmacy and Pharmaceutical Sciences, University for Development Studies, and a voucher specimen (UDS-SPPS/DP1/2023/L010) was deposited in the department herbarium.
Extraction
The stem bark was cut into small pieces, washed, shade-dried, and milled into a fine powder. One hundred grams of the powder were extracted with 500 mL of 50 % (v/v) ethanol or methanol at room temperature on an orbital shaker for 24 h. The extracts were then filtered through cotton wool and concentrated at 60 °C under reduced pressure using a rotary evaporator (Buchi R205, Switzerland). The concentrates were subsequently transferred into sterile containers and lyophilized to obtain the Pericopsis laxiflora hydro-ethanolic extract (HSE) and methanolic extract (MSE). Prior to experimental use, the dried extracts were reconstituted in normal saline to the required concentrations.
Extract characterization
Phytochemical analyses
P. laxiflora stem bark extracts were analyzed for phytochemical constituents using standard procedures 8. Phytochemicals tested for included alkaloids, flavonoids, cyanogenic glycosides, triterpenes, saponins, polyphenols, tannins, reduction sugar, anthracenosides, and phytosterol.
1, 1-Diphenyl-2-Picrylhydrazyl (DPPH) scavenging activity
The effect of HSE and MSE on DPPH radical was estimated using standard methods 9. Briefly, an aliquot of extract (50-500 mg/mL) was added to a methanolic solution of DPPH (1 mM, 1 mL) and 4 mL of distilled water. The mixture was shaken and left to stand for 30 minutes at room temperature. The absorbance of the resulting solution was measured at 517 nm. As standard, ascorbic acid (50 μg) was used. The activity of radical scavenging (RSA) was calculated as the percentage decolouration of DPPH.
Estimation of total phenolic content (TPC)
The total phenolic content of the extracts was assessed using the Folin–Ciocalteu (FC) procedure 10, with minor modifications. Approximately 0.1 g of each extract was dissolved in 5 mL of 0.3 % HCl in methanol/water (60 : 40, v/v). The solution was allowed to stand for 5 minutes and then mixed with 2 mL of 2 % Na₂CO₃. After 2 minutes, 100 μL of 50 % Folin–Ciocalteu reagent was added, and the mixture was incubated for 30 minutes. Absorbance was measured at 750 nm against a gallic acid standard. All extracts were analyzed in triplicate. Gallic acid standards (0.2, 0.4, 0.6, 0.8, and 1.0 mg mL⁻¹) were used to construct the calibration curve. The total phenolic content was calculated from this standard curve and the results were expressed as mg GAE per 100 g dry matter (DM).
Estimation of total flavonoid content (TFC)
The total flavonoid content (TFC) was determined using the aluminium chloride (AlCl3) colorimetric assay, with gallic acid (10–100 mg/L) serving as the calibration standard 10. Briefly, 1.5 mL of 95 % methanol, 100 μL of 10 % AlCl3, 100 μL of 1 M potassium acetate, and 2.8 mL of distilled water were combined with 500 μL of the extract diluted 1:20 and filtered (original concentration 100 mg/mL in methanol). The mixture was incubated for 40 min at ambient temperature, and the absorbance was measured at 415 nm. TFC values were calculated and expressed as milligrams of quercetin equivalents per gram of dry weight.
Estimation of Total Tannins (TT)
The tannin concentration in the plant extracts was quantified using a slightly modified Folin–Ciocalteu assay 11. Briefly, 5 µL of distilled water, 500 µL of Folin–Ciocalteu reagent, and 1 mL of 35 % (w/v) Na₂CO₃ solution were sequentially combined, followed by the addition of 0.5 g of extract. The reaction mixture was thoroughly vortex-mixed and incubated for 30 min at ambient temperature. Gallic acid standard solutions (0.2–1.0 mg mL⁻¹) were prepared identically. Absorbance was recorded at 725 nm, and a calibration curve constructed from the gallic acid standards was used to calculate total tannin content. Results are reported as milligrams of gallic acid equivalents per gram of dry matter (mg GAE g⁻¹ DM).
FTIR analysis
The Fourier transform-infrared (FTIR; Shimadzu 8400S) was used to assess the functional groups contained in extracts. Samples were packed with KBr pellets, and the infrared spectra were recorded. The functional groups present were determined by comparing spectra with standard IR tables 13.
Gas Chromatography-Mass Spectrometry (GCMS) spectra analyses
The extracts (HSE and MSE) were analyzed using gas chromatography–mass spectrometry (GC–MS) to identify the major compounds present. GC–MS analysis of the samples was performed with a PerkinElmer Clarus 580 gas chromatograph interfaced to a Clarus SQ 8 S mass spectrometer, employing the column specifications and operating conditions previously described 14. The total GC–MS run time was 50 min. Mass-spectral interpretation was carried out with the National Institute of Standards and Technology (NIST) library, which includes more than 62,000 reference spectra.
Heavy Metal Analyses
One gram (1.0 g) of each sample was weighed into a 50 mL digestion tube. The sample was mixed with 1.0 mL of deionised water (H₂O), 2.0 mL of concentrated HCl, 5.0 mL of a 1:1 (v/v) mixture of concentrated HNO₃ and 60 % HClO₄, and 2.0 mL of concentrated H₂SO₄. The mixture was allowed to stand for 20 minutes before being heated to 150 °C on a digestion block. After cooling, the digested samples were diluted with distilled water to the 50 mL mark. The digests were then analysed for lead, copper, nickel, zinc, and iron using an Atomic Absorption Spectrometer (Analytikjena nova 400P) 15.
Toxicity Assessment
Animals
Healthy adult male and female Sprague–Dawley rats (age 8–12 weeks; body weight 150–200 g (males) and 120–150 g (females)) were used in the sub-acute toxicity study, whereas albino mice of either sex (20–30 g) were employed for the acute evaluation of HSE and MSE. The animals were procured from the University of Ghana Medical School, Legon, Accra, and housed in polypropylene cages lined with wood shavings. Prior to experimentation, they were acclimatized for two weeks in the animal-holding facility of the Department of Biochemistry and Molecular Medicine under standardized conditions (temperature 25 ± 2 °C; relative humidity 65 %; light/dark cycle 12/12 h). The animals were fed standard rat pellet diet (Agricare, Kumasi), and drinking water was supplied ad libitum via stainless-steel sipper tubes attached to clean polypropylene bottles. Identification was performed by tail-marking with permanent ink. All animal experiments were performed in accordance with the recommendations of the Committee for the Monitoring and Control of Animal Experimentation 16.
Acute oral toxicity (single-dose oral toxicity study – OECD 425)
The acute oral toxicity of HSE and MSE was evaluated in albino mice (both sexes; 20–30 g; n = 6) in accordance with OECD Guideline 425. The extracts were dissolved in normal saline and administered orally by gavage at a maximum dose of 5000 mg/kg body weight. Following administration, animals were observed for mortality, clinical signs of toxicity and behavioural alterations every 4 h for 7 days 17,18.
Sub-chronic oral toxicity of extracts (repeated dose 28-day oral toxicity study in rodents – OECD 407)
The OCED guideline 407 19 was adopted for the sub-chronic toxicity evaluation of HSE and MSE.
Experimental design
Thirty-five (35) male rats (150–200 g) and thirty-five (35) female rats (120–150 g) were randomly allocated to fourteen groups (n = 5 per group) and treated orally once daily for 28 days. The group allocations and treatment regimens are summarised in
Grouping and Treatment of animals in subacute study
| S/N. | Group | Treatment |
|---|---|---|
| Male | ||
| 1 | Normal control | Treated with potable water p.o (1 mL/kg body weight; b.wt) |
| 2 | 100 mg HSE | Treated with 100 mg/kg b.wt of HSE |
| 3 | 250 mg HSE | Treated with 250 mg/kg b.wt of MSE |
| 4 | 500 mg HSE | Treated with 500 mg/kg b.wt of HSE |
| 5 | 100 mg MSE | Treated with 100 mg/kg b.wt of MSE |
| 6 | 250 mg MSE | Treated with 250 mg/kg b.wt of HSE |
| 7 | 500 mg MSE | Treated with 500 mg/kg b.wt of HSE |
| Female | ||
| 8 | Normal control | Treated with potable water p.o (1 mL/kg body weight; b.wt) |
| 9 | 100 mg HSE | Treated with 100 mg/kg b.wt of HSE |
| 10 | 250 mg HSE | Treated with 250 mg/kg b.wt of MSE |
| 11 | 500 mg HSE | Treated with 500 mg/kg b.wt of HSE |
| 12 | 100 mg MSE | Treated with 100 mg/kg b.wt of MSE |
| 13 | 250 mg MSE | Treated with 250 mg/kg b.wt of HSE |
| 14 | 500 mg MSE | Treated with 500 mg/kg b.wt of HSE |
FTIR spectrum of
Effect of treatment on body weight of animals
During treatment, individual body weights of all animals were recorded on the first day (Do) and end of every fourth day (D4, D8, D12, ……. and D28).
The percent change in body weight was calculated using the formula;
Where, Weight n is the weight on D4, D8, D12, D16, D20, D24 and D28 and Weight is the weight on the first day (D).
Effect of treatment on organ weights of rats
The liver, the kidney, the heart, the stomach, the spleen, the lung, the testes (male), and the uterus (female) were collected and rinsed in a buffered saline solution, dried on tissue paper, grossly observed, and weighed to obtain the absolute organ weight (AOW). The Relative Organ Weight (ROW) of each organ was calculated the formula:
Effect of treatment on Haematological Parameters of rats
The haematological profile of the animals was assessed using an automated haematology analyser (Sysmex XS-1000i). The analyser measured haemoglobin (Hb), white-blood-cell (WBC) count, red-blood-cell (RBC) count, haematocrit (HCT), platelet count (PLT), mean corpuscular volume (MCV), mean corpuscular haemoglobin (MCH), mean corpuscular haemoglobin concentration (MCHC), and differential leucocyte counts (neutrophils, lymphocytes, eosinophils, and monocytes). Additionally, non-invasive inflammatory indices, namely the platelet-to-lymphocyte ratio (PLR), neutrophil-to-lymphocyte ratio (NLR), and the combined PLR+NLR index, were calculated.
Effect of treatment on some biochemical parameters
Blood samples collected in activated gel tubes were allowed to clot and were subsequently centrifuged at 1,500 × g for 15 min to obtain serum. Biochemical analyses included glucose, creatinine, urea, sodium, potassium, chloride, total protein, albumin, globulin, total bilirubin (TBil), direct bilirubin (DBil), alanine aminotransferase (ALT), aspartate aminotransferase (AST), triglycerides (TG), and cholesterol fractions (total, HDL, and LDL). All measurements were performed on an automated chemistry analyzer (ADVIA 2400; Siemens Healthcare Diagnostics) using manufacturer-supplied reagents.
Histopathological Studies
The excised liver of animals was fixed in 10% buffered formalin (pH 7.4) and histologically processed. Five microliter sections were cut, stained with haematoxylin-eosin (HE) and tissues examined blindly by a pathologist, microscopically and photomicrographs were taken.
Statistical Analysis
All statistical data were presented as mean ± SEM and analysed using GraphPad Prism for Windows version 8.0 (GraphPad Software, San Diego, CA, USA) with a one-way analysis of variance test followed by Tukey Multiple Comparison Test, at 95% confidence interval.
RESULTS
Preliminary Phytochemical Screening
HSE and MSE after complete drying yielded 38% and 28%, respectively. Preliminary phytochemical screening of HSE and MSE revealed the presence of major phytochemical groups as shown in
Phytochemical constituents of
| Phytochemicals | HSE | MSE |
|---|---|---|
| Alkaloids | ++ | ++ |
| Anthracenoside | + | - |
| Polyphenols | ++ | + |
| Flavonoids | ++ | + |
| Triterpene | + | + |
| Cyanogenic Glycosides | ++ | + |
| Tannins | + | + |
| Saponins | ++ | + |
| Reducing sugar | + | - |
| Phytosterols | + | + |
FTIR spectrum of
Quantitative Phytochemical constituent and radical scavenging activity
Quantitative Phytochemical constituent and radical scavenging activity of extracts
| Test | HSE | MSE | Vitamin C |
|---|---|---|---|
| Total Phenol (mgGAE/g) | 25.23 ± 1.54 | 20.41 ± 2.34 | |
| Total Tannin (mgGAE/g) | 15.96 ± 3.13a | 8.25 ± 1.84a | |
| Total Flavonoid (mgQ/g) | 14.68 ± 2.75a | 9.28 ± 2.14a | |
| DPPH (mg/mL) | 0.48 ± 0.03a | 0.14 ± 0.02a | 0.10 ± 0.04 |
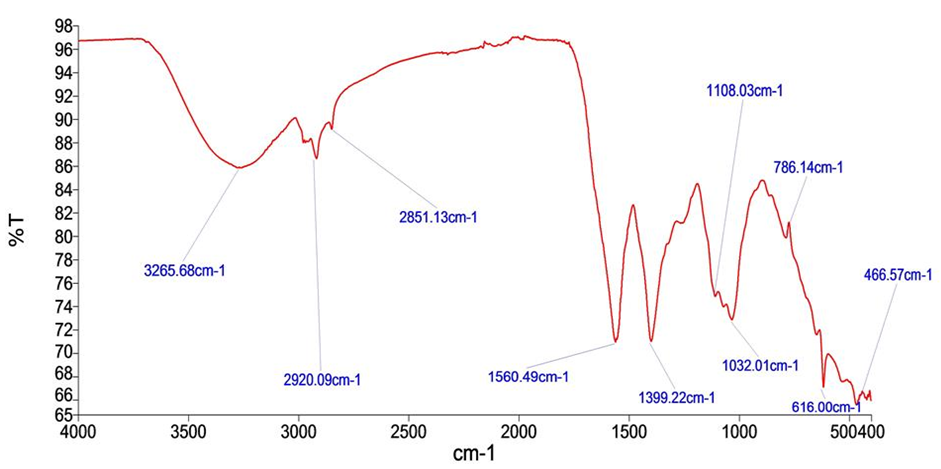
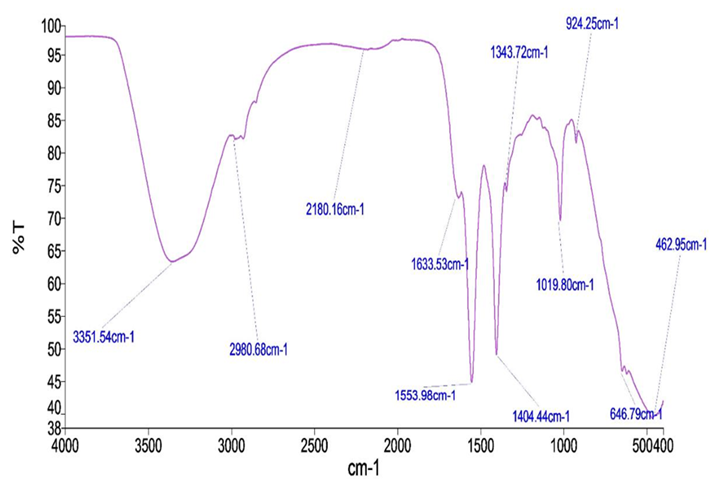
FTIR Spectroscopic Analysis of P. laxiflora Extracts of stem bark
FT-IR spectra of HSE and MSE are shown in
FTIR Peak Values of
| Peak No. | Wave Number (cm-1) | Functional Groups |
|---|---|---|
| HSE | ||
| 1 | 3265.68 | Alcohol, Phenol |
| 2 | 2920.09 | Alkanes |
| 3 | 2851.13 | Aldehydes |
| 4 | 1560.49 | Nitro compound |
| 5 | 1399.22 | Alkanes |
| 6 | 1108.03 | Aliphatic amines |
| 7 | 1032.01 | Aliphatic amines |
| 8 | 786.14 | Aromatics |
| 9 | 616.00 | Alkyl halide |
| 10 | 466.57 | Alkyl halide |
| MSE | ||
| 1 | 3351.54 | Alcohol, Phenol |
| 2 | 2908.68 | Alkanes |
| 3 | 2180.16 | Alkynes |
| 4 | 1633.53 | 1o Amines |
| 5 | 1553.98 | Nitro compounds |
| 6 | 1454.33 | Aromatics |
| 7 | 1343.72 | Nitro compounds |
| 8 | 1019.80 | Aliphatic amines |
| 9 | 924.25 | Carboxylic acids |
| 10 | 462.95 | Alkynes |
GC-MS analyses showing compounds present in HSE
| Peak | RF | Area | Area % | Norm % | SI | COMPOUNDS |
|---|---|---|---|---|---|---|
| 1 | 24.57 | 3,80,571.5 | 1.304 | 5.768 | 95.42 | Cycloheptasiloxane |
| 2 | 25.15 | 2534896.2 | 1.242 | 5.254 | 96.37 | Phenol |
| 3 | 26.67 | 4249132.0 | 0.793 | 4.793 | 95.12 | Cyclotasiloxane |
| 4 | 27.86 | 6440336.5 | 1.203 | 5.203 | 92.32 | Dodecanol |
| 5 | 29.07 | 3539013.5 | 0.661 | 3.661 | 94.67 | Phytol |
| 6 | 29.13 | 4022554.5 | 0.751 | 4.751 | 86.72 | Hexadecanol |
| 7 | 30.00 | 4144050.0 | 0.774 | 4.774 | 92.68 | Toluene-4-sulfonyloxy |
| 8 | 31.83 | 4846425.0 | 0.905 | 4.905 | 94.36 | Oleic acid |
| 9 | 32.68 | 3960120.0 | 0.740 | 4.740 | 97.56 | Estra-1, 3, 5 (10)-trien-17β-ol |
| 10 | 33.96 | 6047608.5 | 1.129 | 5.129 | 96.78 | Hexadecanoic acid |
GC-MS analyses showing compounds present in MSE
| Peak | RF | Area | Area % | Norm % | SI | COMPOUNDS |
|---|---|---|---|---|---|---|
| 1 | 24.56 | 3,80,416.2 | 1.299 | 6.35 | 96.15 | Cycloheptasiloxane |
| 2 | 27.86 | 4267117.7 | 1.342 | 6.45 | 94.75 | 1-hexadecanol, 2-methyl |
| 3 | 29.07 | 4325177.2 | 1.243 | 6.27 | 96.56 | Tetramethyl-2-hexadecenol |
| 4 | 30.00 | 4022554.5 | 0.751 | 4.25 | 86.72 | Hexadecanoic acid |
| 5 | 31.73 | 4144050.0 | 0.774 | 4.39 | 90.69 | 3-Isopropyl |
| 6 | 32.62 | 3658712.5 | 0.605 | 3.43 | 95.07 | Oleic acid |
| 7 | 33.97 | 6254763.6 | 1.253 | 6.30 | 92.36 | 13-Octadecenoic acid |
| 8 | 35.07 | 4236587.1 | 0.853 | 4.98 | 87.58 | Estra-1,3,5-trien-17β-ol |
| 9 | 37.01 | 5268943.4 | 1.254 | 6.30 | 96.71 | Glycidol |
| 10 | 38.01 | 4365721.6 | 1.142 | 5.53 | 98.34 | 2,3-Dihydroxypropyl |
Heavy metal content of raw stem bark plant material, HES and MSE
| Sample | Concentration (mg/L) | ||||
|---|---|---|---|---|---|
| Fe | Zn | Ni | Cu | Pb | |
| Stem Bark Raw | 0.009 ± 0.00 | BDL | BDL | BDL | BDL |
| HSE | 0.004 ± 0.00 | BDL | BDL | BDL | BDL |
| HSE | BDL | BDL | BDL | BDL | BDL |
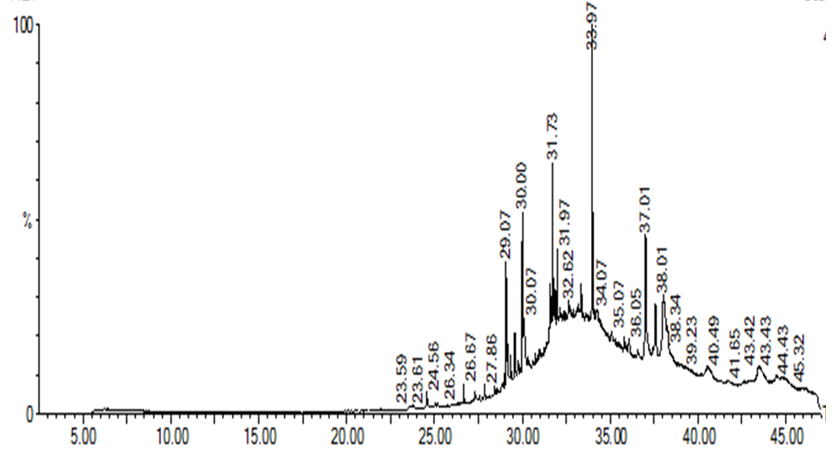
Gas Chromatography-Mass Spectrum Analyses of Extracts
Various compounds were detected in the crude extracts of P. laxiflora. They included cycloheptasiloxane, phenol, hexadecanol, pentadecanone, and oleic acid (Figures 3 and 4;
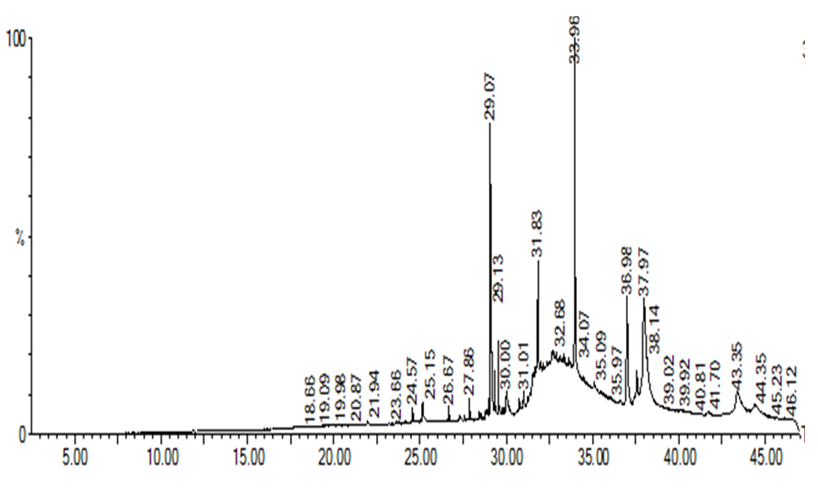
GC-CM spectrum showing peaks of all compounds present in HSE
GC-CM spectrum showing peaks of all compounds present in MSE
Effect of Treatment on Body Weight at Termination
| % Change in Body Weight | ||
|---|---|---|
| Normal | 52.64±5.85 | 49.40±2.24 |
| HSE 100 mg/kg | 30.78±1.04a | 30.87±1.12a |
| HSE 250 mg/kg | 48.42±2.28 | 25.01±0.72a |
| HSE 500 mg/kg | 34.73±1.49a | 26.97±1.52a |
| MSE 100 mg/kg | 33.65±4.74a | 25.01±0.69a |
| MSE 250 mg/kg | 33.79±2.48a | 21.61±2.59a |
| MSE 500 mg/kg | 33.10±2.67a | 21.90±1.35a |
Effect of treatment on relative organ weights in male and female animals
| Treatments | |||||||
|---|---|---|---|---|---|---|---|
| Organ Weight (%) | HSE | MSE | |||||
| Normal | 100 mg | 250 mg | 500 mg | 100 mg | 250 mg | 500 mg | |
| Male | |||||||
| Liver | 5.70 ± 0.61 | 5.52 ± 0.74 | 5.06 ± 0.53 | 5.60 ± 0.19 | 4.29 ± 0.45 | 4.21 ± 0.75 | 4.40 ± 0.22 |
| Lungs | 1.47 ± 0.05 | 1.52 ± 0.20 | 1.76 ± 0.06 | 1.67 ± 0.07 | 1.81 ± 0.04 | 1.58 ± 0.07 | 1.82 ± 0.10 |
| Kidney | 1.35 ± 0.08 | 1.17 ± 0.18 | 1.23 ± 0.10 | 1.52 ± 0.12 | 1.72 ± 0.05 | 1.79 ± 0.17 | 1.42 ± 0.15 |
| Stomach | 1.45 ± 0.15 | 1.01 ± 0.04 | 1.40 ± 0.23 | 1.39 ± 0.11 | 1.68 ± 0.08 | 1.96 ± 0.33 | 2.17 ± 0.20 |
| Heart | 0.99 ± 0.30 | 0.58 ± 0.08 | 0.64 ± 0.04 | 0.63 ± 0.06 | 0.65 ± 0.07 | 0.65 ± 0.04 | 0.79 ± 0.10 |
| Spleen | 0.67 ± 0.01 | 0.68 ± 0.06 | 0.66 ± 0.06 | 0.70 ± 0.04 | 0.67 ± 0.04 | 0.96 ± 0.08 | 1.31 ± 0.18 |
| Testes | 2.33 ± 0.15 | 1.77 ± 0.40 | 2.29 ± 0.07 | 2.44 ± 0.07 | 2.22 ± 0.04 | 2.11 ± 0.40 | 2.52 ± 0.26 |
| Female | |||||||
| Liver | 4.23 ± 0.26 | 4.88 ± 0.45 | 4.07 ± 041 | 5.14 ± 0.14 | 3.79 ± 0.08 | 3.72 ± 0.11 | 3.91 ± 0.11 |
| Lungs | 1.24 ± 0.10 | 1.55 ± 0.23 | 1.47 ± 0.29 | 1.38 ± 0.14 | 1.63 ± 0.08 | 1.75 ± 0.16 | 1.75 ± 0.16 |
| Kidney | 1.09 ± 0.06 | 0.92 ± 0.06 | 0.94 ± 0.09 | 0.78 ± 0.03 | 1.51 ± 0.04 | 1.64 ± 0.04 | 1.64 ± 0.04 |
| Stomach | 1.13 ± 0.06 | 0.96 ± 0.11 | 0.92 ± 0.11 | 1.24 ± 0.05 | 1.64 ± 0.16 | 1.53 ± 0.18 | 1.97 ± 0.12 |
| Heart | 0.58 ± 0.01 | 0.52 ± 0.04 | 0.49 ± 0.02 | 0.53 ± 0.03 | 0.52 ± 0.04 | 0.59 ± 0.03 | 0.62 ± 0.03 |
| Spleen | 0.60 ± 0.04 | 0.75 ± 0.08 | 0.51 ± 0.02 | 0.60 ± 0.03 | 0.74 ± 0.02 | 0.70 ± 0.05 | 0.78 ± 0.34 |
| Uterus | 0.47 ± 0.01 | 0.45 ± 0.11 | 0.44 ± 0.12 | 0.44 ± 0.03 | 0.30 ± 0.05 | 0.63 ± 0.01 | 0.62 ± 0.05 |
Heavy Metal
Acute Toxicity Study
No death was observed within 12 hours of continuous monitoring in the acute toxicity investigations, nor after 7 days. Physical traits (hair, skin, eyes, and nose) seemed normal. There was no salivation, diarrhoea, lethargy, or strange behaviour. The LD could be estimated to be ≥ 5000 mg/kg thus making it safe.
Subacute Toxicity Study
During the 28-day study period, no fatalities were observed in rats receiving HSE or MSE at doses of 100, 250, or 500 mg/kg body weight via oral gavage. Throughout the study, neither male nor female animals exhibited visible morbidity or clinical signs of toxicity, including alterations in skin or fur, eyes, respiratory rate, autonomic functions (salivation, sweating, piloerection), or stereotypic behaviours.
Treatment effect on body weight
There was an increase in body weight in normal and treated groups, both male and female. The normal group had the most significant weight increases in both sexes (Figure 5). At termination, male and female animals receiving 100 and 250 mg/kg HSE respectively recorded the highest weight gain (
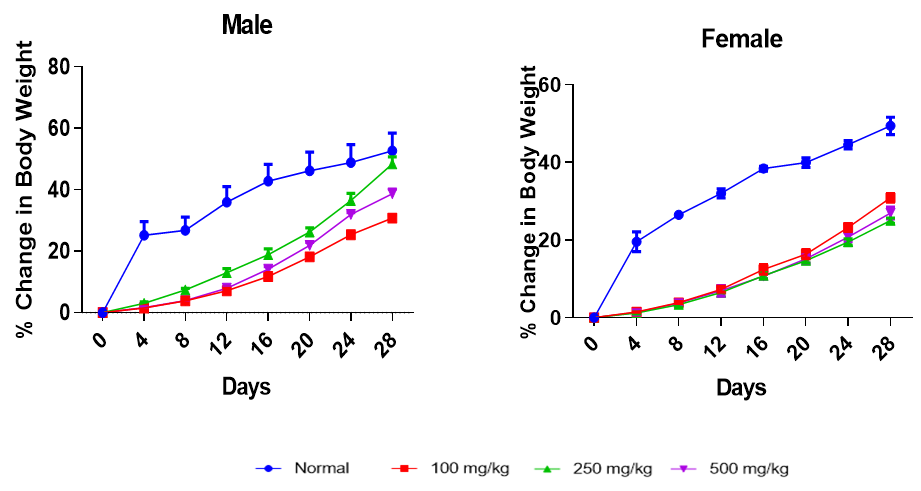
Effect of HSE on percent change in body weight of male and female animals. Each point represents a mean±SEM (n=5)
Effect of treatment on relative organ weight
There was no significant effect of treatment on the relative organ weights of the rats for both sex after administration of HSE or MSE (
Effect of treatment on haematological parameters
There were no significant changes in haematological parameters between control and treated rats, except for the white blood cell count (WBC), which was increased in all treated groups following both extract administrations (
Effect of treatment on haematological parameters on male rats
| Parameters | 100 mg | 250 mg | 500 mg | ||||
|---|---|---|---|---|---|---|---|
| Normal | HSE | MSE | HSE | MSE | HSE | MSE | |
| Male | |||||||
| WBCx103/µL | 10.13 ± 1.65 | 12.87 ± 3.34 | 16.14 ± 0.73a | 12.03 ± 1.52 | 17..03 ± 0.52a | 19.57 ± 1.21a | 25.55 ± 0.16a |
| RBCx106/µL | 8.37 ± 0.51 | 8.95 ± 0.70 | 8.64 ± 0.53 | 9.97 ± 0.37 | 7.89 ± 0.49 | 7.51 ± 0.91 | 8.03 ± 0.21 |
| HGB g/dL | 14.00 ± 0.96 | 15.10 ± 0.35 | 14.36 ± 0.94 | 15.81 ± 3.20 | 14.41 ± 0.76 | 16.63 ± 3.06 | 14.57 ± 0.64 |
| HCT% | 48.73 ± 3.84 | 53.40 ± 1.47 | 50.91 ± 1.00 | 50.90 ± 3.59 | 50.57 ± 2.01 | 47.98 ± 2.79 | 51.80 ± 1.10 |
| MCV fL | 58.07 ± 1.09 | 61.00 ± 3.63 | 63.00 ± 2.53 | 54.93 ± 1.64 | 64.20 ± 1.36 | 55.87 ± 3.20 | 64.53 ± 1.65 |
| MCH pg | 16.70 ±0.12 | 17.27 ± 1.12 | 17.77 ± 0.77 | 16.93 ± 1.64 | 16.50 ± 0.60 | 15.73 ± 0.76 | 18.17 ± 0.72 |
| LYM% | 86.67 ± 2.23 | 82.20 ± 1.72 | 80.13 ± 0.95 | 83.93 ± 2.98 | 80.65 ± 2.68 | 79.10 ± 1.87 | 83.05 ± 2.10 |
| NEUT% | 19.33 ± 2.23 | 18.87 ± 0.58 | 19.87 ± 0.95 | 21.07 ± 2.98 | 18.27 ± 1.89 | 21.60 ± 1.84 | 19.56 ± 1.80 |
| RDW-SD fL | 39.53 ± 1.27 | 38.37 ± 3.28 | 40.20 ± 4.47 | 38.47 ± 1.16 | 40.28 ± 1.79 | 38.60 ± 0.96 | 42.43 ± 2.09 |
| RDW-CV % | 16.47 ± 0.58 | 16.83 ± 0.69 | 17.27 ± 1.42 | 16.97 ± 0.95 | 18.57 ± 1.33 | 17.63 ± 0.70 | 18.10 ± 0.40 |
| PDW fL | 11.70 ± 0.70 | 8.23 ± 0.33 | 9.97 ± 1.05 | 8.37 ± 0.22 | 9.70 ± 0.29 | 8.97 ± 0.78 | 11.83 ± 1.40 |
| MPV fL | 8.33 ± 0.12 | 7.87 ± 0.12 | 7.80 ± 0.50 | 7.93 ± 0.23 | 7.70 ± 0.10 | 7.87 ± 0.43 | 8.67 ± 0.48 |
| P-LCR % | 16.23 ± 1.23 | 15.53 ± 0.72 | 14.82 ± 0.96 | 15.53 ± 1.01 | 15.81 ± 1.07 | 16.47 ± 2.58 | 17.30 ± 4.17 |
| PCT % | 0.85 ± 0.08 | 0.55 ± 0.04 | 0.43 ± 0.09 | 0.70 ± 0.10 | 0.50 ± 0.05 | 0.43 ± 0.09 | 0.61 ± 0.18 |
| PLT (uL) | 842.67 ± 80.42 | 897.00 ± 75.12 | 784.67 ± 14.52 | 880.33 ± 63.28 | 922.33 ± 49.33 | 952.00 ± 30.24 | 819.67 ± 79.71 |
Effect of treatment on haematological parameters on Female rats
| Parameters | 100 mg | 250 mg | 500 mg | ||||
|---|---|---|---|---|---|---|---|
| Normal | HSE | MSE | HSE | MSE | HSE | MSE | |
| Female | |||||||
| WBCx103/µL | 11.53 ± 0.58 | 12.50 ± 2.00 | 15.98 ± 0.90a | 15.85 ± 0.71a | 21.33 ± 0.62a | 11.07 ± 1.29 | 17.13 ± 1.90a |
| RBCx106/µL | 8.64 ± 0.06 | 7.86 ± 0.68 | 7.41 ± 0.39 | 8.64 ± 0.54 | 8.27 ± 0.63 | 7.93 ± 0.49 | 9.24 ± 0.58 |
| HGB g/dL | 15.20 ± 0.12 | 14.87 ± 1.28 | 14.50 ± 1.80 | 14.47 ± 0.54 | 13.27 ± 0.62 | 14.23 ± 0.47 | 13.07 ± 0.58 |
| HCT% | 50.30 ± 0.17 | 42.33 ± 4.35 | 50.53 ± 2.45 | 51.33 ± 0.32 | 51.47 ± 0.31 | 48.87 ± 2.43 | 48.64 ± 1.05 |
| MCV fL | 58.20 ± 0.46 | 61.73 ± 1.62 | 64.20 ± 0.81 | 59.90 ± 3.45 | 64.00 ± 0.31 | 61.73 ± 1.82 | 60.27 ± 1.45 |
| MCH pg | 17.60 ± 0.06 | 18.77 ± 0.60 | 19.03 ± 0.27 | 17.67 ± 1.41 | 17.70 ± 1.62 | 18.47 ± 0.58 | 19.43 ± 0.43 |
| LYM% | 82.70 ± 3.98 | 75.13 ± 4.68 | 87.80 ± 1.48 | 77.23 ± 2.50 | 79.50 ± 2.24 | 76.03 ± 6.87 | 78.57 ± 1.66 |
| NEUT% | 19.30 ± 3.98 | 22.87 ± 4.68 | 18.19 ± 1.27 | 22.77 ± 2.50 | 20.50 ± 2.24 | 20.97 ± 6.87 | 21.43 ± 1.66 |
| RDW-SD fL | 36.77 ± 2.42 | 29.57 ± 0.66 | 42.83 ± 2.14 | 29.53 ± 0.72 | 40.90 ± 1.14 | 30.43 ± 2.24 | 42.63 ± 2.68 |
| RDW-CV % | 12.63 ± 1.31 | 11.67 ± 0.61 | 12.13 ± 0.82 | 11.83 ± 0.69 | 13.00 ± 1.00 | 12.10 ± 1.17 | 11.13 ± 2.49 |
| PDW fL | 11.77 ± 0.77 | 9.77 ± 0.38 | 10.03 ± 0.34 | 11.57 ± 0.13 | 10.50 ± 0.10 | 10.00 ± 0.36 | 10.57 ± 0.13 |
| MPV fL | 8.07 ± 0.03 | 7.37 ± 0.29 | 7.57 ± 0.18 | 7.27 ± 0.12 | 8.33 ± 0.09 | 7.83 ± 0.26 | 8.30 ± 0.25 |
| P-LCR % | 13.97 ± 0.26 | 11.27 ± 1.68 | 12.40 ± 1.27 | 10.93 ± 0.83 | 13.80 ± 0.40 | 11.53 ± 1.09 | 14.27 ± 1.23 |
| PCT % | 0.53 ± 0.03 | 0.52 ± 0.13 | 0.52 ± 0.09 | 0.77 ± 0.04 | 0.54 ± 0.03 | 0.72 ± 0.05 | 0.53 ± 0.05 |
| PLT (uL) | 781.33 ± 36.54 | 714.33 ± 98.14 | 778.73 ± 41.84 | 859 ± 63.26 | 843.67 ± 30.39 | 853.67 ± 40.99 | 738.67 ± 38.35 |
Effect of Treatment on Non-Invasive Inflammatory Indices
| Male | Female | |||||
|---|---|---|---|---|---|---|
| PLR | NLR | PLR+NLR | PLR | NLR | PLR+NLR | |
| Normal | 89.80 ± 36.70 | 0.27 ± 0.04 | 90.07 ± 36.67 | 76.45 ± 7.79 | 0.22 ± 0.06 | 76.67 ± 7.82 |
| 100 mg HSE | 92.51 ± 8.10 | 0.22 ± 0.03 | 92.73 ± 8.11 | 73.44 ± 14.57 | 0.34 ± 0.09 | 73.78 ± 14.49 |
| 250 mg HSE | 90.98 ± 38.71 | 0.36 ± 0.05 | 91.34 ± 38.76 | 72.90 ± 7.35 | 0.30 ± 0.04 | 73.20 ± 7.38 |
| 500 mg HSE | 93.64 ± 37.94 | 0.27 ± 0.03 | 93.91 ± 37.97 | 74.34 ± 37.03 | 0.26 ± 0.13 | 74.60 ± 37.13 |
| 100 mg MSE | 85.56 ± 18.53 | 0.25 ± 0.01 | 85.81 ± 18.54 | 78.46 ± 5.50 | 0.14 ± 0.02 | 78.60 ± 5.49 |
| 250 mg MSE | 90.04 ± 10.35 | 0.26 ± 0.06 | 90.30 ± 10.38 | 81.51 ± 5.73 | 0.26 ± 0.04 | 81.77 ± 5.76 |
| 500 mg MSE | 90.32 ± 12.27 | 0.24 ± 0.19 | 90.56 ± 12.22 | 77.07 ± 2.40 | 0.27 ± 0.03 | 77.34 ± 2.37 |
Effect of treatment on biochemical parameters
Effect of treatment on biochemical parameters in male rats
| Parameters | 100 mg | 250 mg | 500 mg | ||||
|---|---|---|---|---|---|---|---|
| Normal | HSE | MSE | HSE | MSE | HSE | MSE | |
| Male | |||||||
| AST (U/L) | 125.37 ± 7.21 | 119.00 ± 10.02 | 122.00 ± 3.06 | 116.27 ± 12.71 | 121.00 ± 2.89 | 115.73 ± 2.41 | 133.00 ± 7.20 |
| ALT (U/L) | 42.67 ± 1.45 | 42.00 ± 4.04 | 39.00 ± 3.61 | 48.33 ± 0.86 | 41.80 ± 5.14 | 46.04 ± 1.08 | 44.83 ± 2.92 |
| CKMB (U/L) | 1569.21 ± 342.26 | 1616.00 ± 88.64 | 1595.5 ± 135.54 | 1599.9 ± 42.54 | 1475.8 ± 236.88 | 1741.6 ± 35.52 | 1695.5 ± 67.53 |
| LDH (U/L) | 4059.2 ± 170.42 | 3863.3 ± 140.71 | 4006.0 ± 213.51 | 3991.5 ± 110.13 | 4235.9 ± 176.62 | 4152.4 ± 93.38 | 3928.4 ± 96.70 |
| Creatinine (mmol/L) | 39.77 ± 1.61 | 36.07 ± 0.87 | 37.50 ± 3.43 | 39.50 ± 6.16 | 44.34 ± 3.69 | 39.65 ± 1.11 | 47.08 ± 3.42 |
| Urea (mmol/L) | 7.37 ± 0.18 | 8.42 ± 0.49 | 7.31 ± 1.02 | 8.33 ± 0.59 | 10.63 ± 1.54 | 9.06 ± 0.53 | 12.22 ± 2.54 |
| TCHOL. (mmol/l) | 1.90 ± 003 | 1.90 ± 0.80 | 1.56 ± 0.36 | 2.07 ± 0.14 | 1.83 ± 0.25 | 2.12 ± 0.11 | 2.46 ± 0.05 |
| TRIG. (mmol/l) | 0.64 ± 0.05 | 0.78 ± 0.15 | 0.62 ± 0.15 | 0.87 ± 0.08 | 0.72 ± 0.02 | 0.93 ± 0.05 | 0.85 ± 0.07 |
| HDL-C (mmol/l) | 0.91 ± 002 | 0.90 ± 0.15 | 1.25 ± 0.25 | 0.93 ± 0.19 | 1.16 ± 0.16 | 0.97 ± 0.12 | 1.11 ± 0.37 |
| LDL-C (mmol/l) | 0.86 ± 0.02 | 0.90 ± 0.06 | 1.08 ± 0.22 | 1.17 ± 0.20 | 1.15 ± 0.36 | 1.10 ± 0.23 | 1.19 ± 0.15 |
| VLDL (mmol/l) | 0.39 ± 0.02 | 0.33 ± 0.09 | 0.39 ± 0.06 | 0.35 ± 0.04 | 0.47 ± 0.16 | 0.38 ± 0.02 | 0.42 ± 0.13 |
| Potassium (mmol/L) | 8.13 ± 0.31 | 8.58 ± 0.80 | 11.58 ± 2.06 | 10.81 ± 0.77 | 9.98 ± 1.78 | 10.08 ± 1.47 | 13.72 ± 1.07 |
| Sodium (mmol/L) | 143.87 ± 0.64 | 147.21 ± 3.64 | 140.27 ± 9.13 | 139.75 ± 5.06 | 142.63 ± 8.59 | 142.20 ± 2.62 | 147.63 ± 8.29 |
| Chloride (mmol/L) | 103.23 ± 0.67 | 103.47 ± 4.22 | 102.63 ± 4.68 | 116.89 ± 1.73 | 114.93 ± 3.54 | 108.25 ± 4.57 | 120.60 ± 6.41 |
Effect of treatment on biochemical parameters in female rats
| Parameters | 100 mg | 250 mg | 500 mg | ||||
|---|---|---|---|---|---|---|---|
| Normal | HSE | MSE | HSE | MSE | HSE | MSE | |
| Female | |||||||
| AST (U/L) | 120.13 ± 5.68 | 131.33 ± 10.84 | 125.30 ± 10.84 | 116.33 ± 4.26 | 124.33 ± 4.33 | 122.17 ± 12.33 | 128.30 ± 8.66 |
| ALT (U/L) | 30.7 ± 4.19 | 28.33 ± 2.91 | 29.83 ± 0.52 | 30.67 ± 4.33 | 33.37 ± 1.41 | 30.67 ± 3.70 | 33.77 ± 2.61 |
| CKMB (U/L) | 1720.3 ± 526.82 | 1678.3 ± 132.20 | 1633.7 ± 76.72 | 1755.1 ± 145.11 | 1704.7 ± 31.42 | 1795.36 ± 94.8 | 1782.63 ± 64.83 |
| LDH (U/L) | 3968.1 ± 392.16 | 4002.8 ± 214.17 | 3646.0 ± 64.60 | 3886.2 ± 247.38 | 3912.0 ± 158.13 | 4112.3 ± 187.20 | 4126.70 ± 128.03 |
| Creatinine (mmol/L) | 46.40 ± 2.43 | 36.33 ± 4.91 | 43.67 ± 3.06 | 42.50 ± 4.13 | 48.27 ± 4.10 | 47.77 ± 2.23 | 43.43 ± 2.71 |
| Urea (mmol/L) | 9.94 ± 0.27 | 10.21 ± 1.92 | 8.78 ± 1.66 | 7.16 ± 1.91 | 8.89 ± 0.82 | 8.77 ± 0.78 | 9.70 ± 1.40 |
| TCHOL. (mmol/l) | 2.21 ± 0.16 | 2.79 ± 0.33 | 2.33 ± 0.59 | 3.44 ± 0.30 | 2.34 ± 0.40 | 3.69 ± 1.02 | 3.82 ± 0.18 |
| TRIG. (mmol/l) | 0.83 ± 0.02 | 0.46 ± 0.80 | 0.99 ± 0.26 | 0.76 ± 0.65 | 0.82 ± 0.21 | 0.98 ± 0.18 | 1.42 ± 0.10 |
| HDL-C (mmol/l) | 1.31 ± 0.11 | 1.39 ± 0.80 | 1.29 ± 0.16 | 1.46 ± 0.65 | 1.52 ± 0.15 | 1.52 ± 0.42 | 1.32 ± 0.10 |
| LDL-C (mmol/l) | 0.93 ± 0.06 | 0.84 ± 0.75 | 0.70 ± 0.08 | 0.90 ± 0.51 | 1.18 ± 0.16 | 1.23 ± 0.61 | 1.30 ± 0.10 |
| VLDL (mmol/l) | 0.38 ± 0.01 | 0.49 ± 0.24 | 0.41 ± 0.10 | 0.35 ± 0.47 | 0.49 ± 0.09 | 0.51 ± 0.57 | 0.64 ± 0.05 |
| Potassium (mmol/L) | 6.86 ± 0.48 | 6.33 ± 0.12 | 6.06 ± 0.65 | 6.72 ± 0.37 | 7.09 ± 0.57 | 7.11 ± 0.28 | 6.98 ± 1.22 |
| Sodium (mmol/L) | 144.03 ± 0.67 | 148.99 ± 0.74 | 140.00 ± 6.93 | 133.67 ± 0.63 | 150.00 ± 6.93 | 147.47 ± 0.82 | 146.67 ± 6.96 |
| Chloride (mmol/L) | 102.80 ± 0.80 | 105.68 ± 1.10 | 103.67 ± 5.24 | 105.43 ± 1.08 | 108.67 ± 3.48 | 107.12 ± 1.00 | 114.00 ± 5.29 |
Effect of treatment on liver histology
Figure 7 shows the effect of treatment on liver histology. No major pathological alterations were observed in the gross and histopathological examination of the liver.
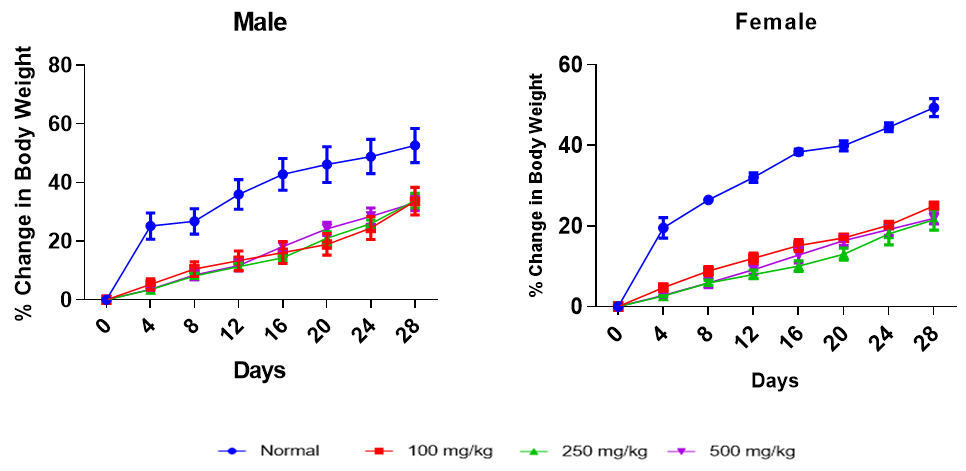
Effect of MSE on percent change in body weight of male and female animals. Each point represents a mean±SEM (n=5) with: (A) distilled water (control), (B) 100 mg/kg b.wt of HSE, (C) 100 mg/kg b.wt of MSE, (D) 250 mg/kg b.wt of HSE, (E) 250 mg/kg b.wt of MSE, (F) 500 mg/kg b.wt of HSE, (G) 500 mg/kg b.wt of MSE, (H) distilled water (control), (I) 100 mg/kg b.wt of HSE, (J) 100 mg/kg b.wt of MSE, (K) 250 mg/kg b.wt of HSE, (L) 250 mg/kg b.wt of MSE, (M) 500 mg/kg b.wt of HSE and (N) 500 mg/kg b.wt of MSE.
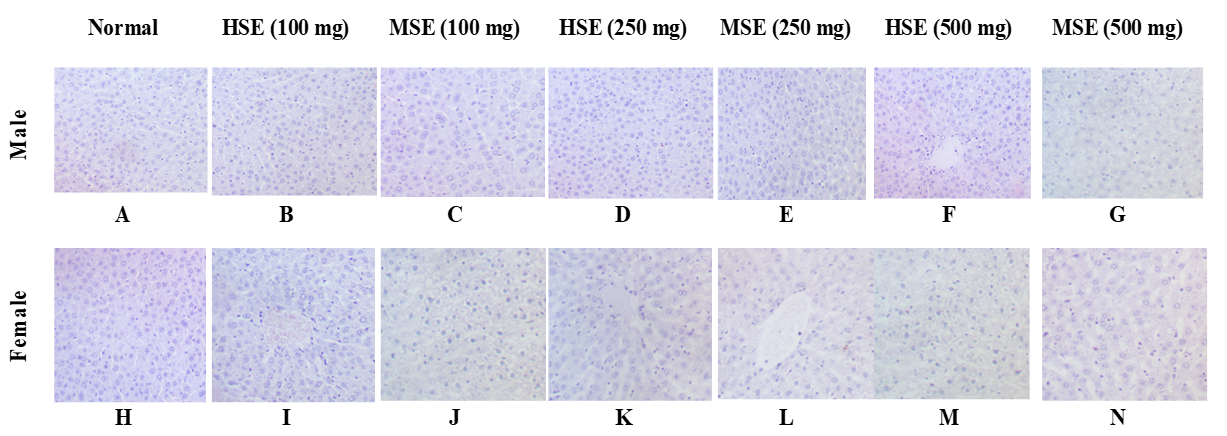
Photomicrographs of liver from rats administered orally for 28 days with: (A) distilled water (control), (B) 100 mg/kg b.wt of HSE, (C) 100 mg/kg b.wt of MSE, (D) 250 mg/kg b.wt of HSE, (E) 250 mg/kg b.wt of MSE, (F) 500 mg/kg b.wt of HSE, (G) 500 mg/kg b.wt of MSE, (H) distilled water (control), (I) 100 mg/kg b.wt of HSE, (J) 100 mg/kg b.wt of MSE, (K) 250 mg/kg b.wt of HSE, (L) 250 mg/kg b.wt of MSE, (M) 500 mg/kg b.wt of HSE and (N) 500 mg/kg b.wt of MSE. Photomicrograph (A) – (N) shows normal hepatocytes with no observable lesion. (H&E X 400).
DISCUSSION
In many countries, medicinal plants and their bioactive constituents are employed as adjuncts to conventional pharmacotherapy. Systematic investigation of the toxicological profiles of herbal preparations is required to establish safe, evidence-based dosage regimens for animals and humans 20,21,22. To date, only limited toxicity data are available for Pericopsis species—P. elata 23, P. angolensis 24, and P. mooniana 25. However, no published toxicological evaluations of hydroethanolic or methanolic stem-bark extracts of P. laxiflora exist, despite their documented ethnomedicinal use. Unrecognized adverse effects could compromise safety during prolonged consumption. Consequently, the present study furnishes the first experimental evidence of the potential toxicity associated with the hydroethanolic (HSE) and methanolic (MSE) stem-bark extracts of P. laxiflora.
Preliminary phytochemical screening revealed the presence of alkaloids, polyphenols, flavonoids, cyanogenic glycosides, triterpenes, tannins, saponins, reducing sugars, and phytosterols in P. laxiflora. These metabolites are likely to underlie the pronounced antioxidant activity observed. Indeed, numerous reports, including that of Ouattara et al. 26, have demonstrated a strong correlation between the occurrence of these constituents and antioxidant capacity. Collectively, these phytochemicals exhibit diverse pharmacological activities. Tannin-rich plants are employed for the management of various disorders and display hypolipidaemic and anticancer effects 27. Flavonoids, a class of potent polyphenols, act as efficient free-radical scavengers, as corroborated by multiple studies 28,29,30. Alkaloids contribute to pathogen defence and modulate oxidative stress as well as hormonal signalling 31. Alkaloids, flavonoids, and saponins have been shown to protect hepatic and renal tissues from carbon tetrachloride-induced injury in rats by attenuating oxidative stress 32. Glycosides exhibit antiprotozoal and antimicrobial activities and are additionally employed as astringents 33. These compounds inhibit Na⁺/K⁺-ATPase, thereby reducing heart rate. Triterpenoids likewise display anti-inflammatory, insecticidal, sedative, and cytotoxic properties 34. Collectively, these phytochemicals may act synergistically to enhance therapeutic efficacy 35.
FTIR analysis revealed functional groups characteristic of phenols, alkanes, aromatic carboxylic acids, alkynes, and alcohols, corroborating the presence of these phytoconstituents in P. laxiflora. GC–MS profiling additionally identified phenols, oleic acid, and phytol, compounds previously associated with hepatoprotective and anti-fibrotic activities. Radical-scavenging capacity, assessed by the DPPH assay, was greater in the methanolic extract than in the hydro-solvent extract (HSE), although the HSE exhibited the highest total phenolic content (TPC), total tannins (TT), and total flavonoid content (TFC). Plant-derived phenolics are potent antioxidants and have been implicated in carcinogenesis inhibition 36.
Heavy-metal contamination has been documented in certain medicinal plants, contributing to their toxicity 37; therefore, the extracts were screened for metal content. No iron, zinc, lead, nickel, or copper was detected in the crude extract; however, trace amounts of iron (0.009 ± 0.00 mg/g) and zinc (0.004 ± 0.00 mg/g) were present in the raw powdered material. Rigorous toxicity evaluation remains the scientific basis for certifying the safety of phytotherapeutics, and it has been recommended that herbal preparations undergo safety assessments comparable to those required for synthetic drugs 38.
In the current study, the oral median lethal dose (LD₅₀) exceeded 5000 mg/kg body weight, indicating that both HSE and methanolic extracts (MSE) are practically non-toxic under acute exposure. Sub-acute testing, performed at 100, 250, and 500 mg/kg for 28 days in male and female rats, was used to define safe dosage ranges and to detect target-organ effects. Body-weight reduction is a classical indicator of systemic toxicity 39; however, all treated animals showed progressive weight gain, implying an absence of overt toxicity. Similarly, no significant changes were observed in relative organ weights when compared with controls, corroborating the non-toxic nature of the extracts at the administered doses.
Haematological indices are reliable tools for monitoring systemic toxicity in experimental animals. Exposure to toxic or foreign substances can modify the expected reference ranges of these parameters 40. In the present study, treated animals exhibited significant increases in white blood cell (WBC) counts at the high dose of 500 mg kg⁻¹ in both sexes receiving HSE, and at all doses (100, 250, and 500 mg kg⁻¹) in both sexes receiving MSE. A rise in WBCs is a recognised marker of physiological stress and part of the host defence mechanism against inflammatory conditions 12, and is therefore regarded as an adaptive response rather than an adverse effect. Apart from these WBC changes, most haematological parameters (
The liver plays a central role in the metabolism of xenobiotics, lipids, carbohydrates and proteins, rendering both the liver and kidneys susceptible to drug-induced injury 41. Given the rising global incidence of liver and kidney disease, including drug-induced liver injury (DILI), evaluation of these organs is crucial in safety studies of plant extracts. In the current work, no significant differences were observed in any measured biochemical parameter when compared with controls. Alanine aminotransferase (ALT) is the preferred indicator of hepatocellular injury, and its unchanged activity at all doses suggests an absence of hepatic toxicity. Similarly, serum creatinine and urea concentrations remained within normal limits, signifying preserved renal function 42. The lack of significant alterations in electrolyte profiles provides additional evidence for the non-deleterious effects of the treatments on renal homeostasis. Finally, unchanged serum triglyceride and cholesterol levels indicate that carbohydrate and lipid metabolism were not perturbed, further supporting the oral safety of the investigated plant extracts.
Lactate dehydrogenase (LDH) is released in tumoural contexts owing to various cytokine activities and cell-membrane damage 31. In the present study, neither LDH nor creatine kinase-MB (CK-MB) levels were elevated, thereby excluding abnormal proliferation or damage to cardiomyocytes, erythrocytes and hepatocytes in the treated animals. Histopathological examination—particularly of the liver—is an established approach for assessing drug-induced toxicity 43. Both gross and microscopic evaluations revealed no significant pathological alterations in hepatic tissue.
CONCLUSION
The present study demonstrates that hydroethanolic and methanolic stem-bark extracts of P. laxiflora contain phytoconstituents with putative therapeutic activity. The oral median lethal dose (LD₅₀) was estimated to exceed 5 000 mg kg⁻¹ body-weight, suggesting a wide safety margin. Biochemical analyses indicate that both hydroethanolic (HSE) and methanolic (MSE) extracts are well-tolerated at the tested oral doses. Histopathological assessment of hepatic tissue revealed no detectable lesions in animals treated with either extract at any dose. The observed increases in circulating white-blood-cell (WBC) counts in both male and female rats may represent an adaptive immunological response. Collectively, these findings support the safety profile and antioxidant capacity of Pericopsis laxiflora extracts, underscoring the need for additional pharmacological investigations to facilitate their potential commercial development.
Abbreviations
AOW: Absolute Organ Weight; ALT: Alanine Aminotransferase; AST: Aspartate Aminotransferase; BDL: Below Detection Limit; b.wt or bw: Body Weight; CK-MB: Creatine Kinase-MB; DBil: Direct Bilirubin; DM: Dry Matter; DPPH: 2,2-Diphenyl-1-picrylhydrazyl; FC: Folin–Ciocalteu; FT-IR: Fourier-Transform Infrared; GAE: Gallic Acid Equivalents; GC–MS: Gas Chromatography–Mass Spectrometry; Hb: Haemoglobin; HCT: Haematocrit; HDL: High-Density Lipoprotein; HSE: Hydroethanolic Extract; IC₅₀: Half Maximal Inhibitory Concentration; IR: Infrared; LD₅₀: Median Lethal Dose; LDH: Lactate Dehydrogenase; LDL: Low-Density Lipoprotein; LYM: Lymphocytes; MCH: Mean Corpuscular Haemoglobin; MCHC: Mean Corpuscular Haemoglobin Concentration; MCV: Mean Corpuscular Volume; MSE: Methanolic Extract; NEUT: Neutrophils; NIST: National Institute of Standards and Technology; NLR: Neutrophil-to-Lymphocyte Ratio; OECD: Organisation for Economic Co-operation and Development; OD: Optical Density; P-LCR: Platelet-Large Cell Ratio; PCT: Plateletcrit; PDW: Platelet Distribution Width; PLR: Platelet-to-Lymphocyte Ratio; PLT: Platelets; p.o: Per Os (Oral Administration); RBC: Red Blood Cell; RDW-CV: Red Cell Distribution Width–Coefficient of Variation; RDW-SD: Red Cell Distribution Width–Standard Deviation; ROW: Relative Organ Weight; RSA: Radical Scavenging Activity; SEM: Standard Error of the Mean; TBil: Total Bilirubin; TCHOL: Total Cholesterol; TFC: Total Flavonoid Content; TG: Triglycerides; TPC: Total Phenolic Content; TT: Total Tannins; VLDL: Very Low-Density Lipoprotein; WBC: White Blood Cell
Data Availability
The data used to support the findings of this study are available within the article.
Acknowledgment
The authors are grateful to the University for Development Studies for providing the laboratory to support this study.
Authors’ Contributions
All authors contributed equally to this work
Funding
No funding was received for this work.
Disclosure
The authors report no conflicts of interest for this work.