 Open Access
 Abstract
Background: Physical activity is one of the leading health indicators, considered an essential factor in the population's health and quality of life promotion. Physical inactivity is the fourth leading risk factor for global mortality. Physical inactivity has been linked with chronic disease and obesity in most populations. This study aims to compare the prevalence of physical activity and overweight/obesity among students of the university.
Methods: A cross-sectional survey was conducted from March to September 2019 on undergraduate students from different departments of Peshawar University. A sample of 377 (male n = 243, female n = 134) was taken through convenience sampling. Those individuals who were physically disabled and not willing to participate were excluded from the study. Those meeting the inclusion criteria were given the International Physical Activity Questionnaire (IPAQ short form). Demographic data included age, weight, and height was self-stated by the participants. The levels of physical activity in each of three domains (leisure, transport, and domestic) were calculated and presented as metabolic equivalent (M.E.T.) hour per week in the form of means, percentage, and frequency in different physical activity domains.
Results: The overall sample showed that 13.70% of participants were inactive, 27.76% showed a low level of physical activity, 41.29% showed moderate physical activity level, and 17.24% showed a high level of physical activity. A total of 90.98% of participants were involved in leisure physical activities, 93.10% presented transport-related physical activity, and 74.80% were involved in domestic-related physical activity. Average time spent during sitting was found to be 53.32 hrs/week and 7.61 hrs/ day, with females being more involved in sitting activities as compared to males. A significant difference was found between B.M.I. and sitting domain (p-value 0.002) with a Pearson value of -0.12 showing a negative correlation.
Conclusion: The B.M.I. and Physical Activity are found negatively associated with each other. Male students were more physically active than females as females spend their majority of time sitting. It is concluded that students are moderately active, while a minimal percent of students are highly active. There were a few numbers of respondents too who were physically inactive, which shows that there is still unawareness of physical activity on the university level.
INTRODUCTION
According to the definition by the World Health Organization (WHO), physical activity is "any bodily movement produced by skeletal muscles that require energy expenditure". The word physical activity and exercise are inter-connected but not the same, exercise is a segment of physical activity that is planned, well-ordered, and is done constantly in such a way that the goal is to attain physical fitness 1 .
Being physically active is mostly seen during a young age, but it declines gradually with the age of a person. This decline usually begins slowly in college life and gradually increases at the university level. Evidence shows that one-third of formerly active students become dull during this transition to University 2 . However, in universities, students are not provided with the proper physical education structure; there is no promotion of health and activities.
According to the Centre for Disease Control (C.D.C.), a minimum of 30 minutes of the moderate-intensity physical activity level for a minimum of five days per week for the young population is required (intensity of moderate physical activity is 150 minutes per week). However, around 60% of the worldwide population cannot complete the actual physical activity level required for a healthy lifestyle and benefits 3 . One must meet the physical activity criteria that individual must participate in moderate physical activity to vigorous physical activities for a minimum of 60 minutes a day, thus reaching the sum of 300 minutes a week 4 .
Physical activity plays a significant role in weight reduction, weight control, and body fitness 5 . Physical activity also increases the lung's capacity, aerobic level, body quickness, coordination, muscle endurance, strength, and metabolic working 6 . Physical activity is related to a high level of self-esteem, lower stress, and anxiety 7 . In the early years, it was known that vigorous activities had benefited in health, but with time and further studies, it is now known that not just vigorous exercise but performing daily activities at a moderate intensity can help to achieve health benefits 8 , 9 .
While physical inactivity can have adverse effects on the body, there is a risk of weight gain, metabolic functions, respiratory functions, cardiovascular problems, bones, and muscle weakness. Mental health is affected, such as anxiety, stress 10 . World Health Organization (WHO) identified that Physical inactivity is ranked as number four of all-source mortality list 11 . The worldwide records show that around 1.9 million preventable deaths per annum are due to physical inactivity 5 . It is globally shown that physical inactivity accounts for breast cancer 10%, colon cancer 16%, diabetes 14%, ischemic stroke 11%, and ischemic heart disease 22% 12 . It is globally known that round about 70% of the worldwide population lives a sedentary lifestyle; the definitions of 'sedentarism' or sedentary lifestyle are based on the quantitative calculation of energy expenditure (metabolic equivalents or MET-h/wk.) 13 .
Despite the fact that physical inactivity is increasing day by day, work has been done on the level of physical activity in various foreign countries, but there is a limited study available in developing countries like Pakistan. No study was found in Peshawar, especially in the University of Peshawar. Therefore, this study is designed to measure the level of physical activity in undergraduate students of Peshawar University, Pakistan, to self-rate their involvement in physical activity in their last seven days using an international physical activity questionnaire.
METHODOLOGY
The study was conducted at Peshawar University, Pakistan. A cross-sectional study survey method was used. We chose a non-probability sampling of convenience. Online sample size calculator Rao soft was used to determine sample size. With a 5% margin of error, 95% confidence interval, and population of 20000, a sample size of 377 was calculated. The total time taken was almost six months, starting from March and concluding in September.
Those who met the following criteria were included in the study; the participants were between 18 and 25 years, both male and female, those who were willing to participate in enrolled undergraduate students.
Students who lacked physical activity due to any disability had any trauma like a fracture, sprain, or strain were not part of the current study.
B.M.I. was graded according to the new values for Asian people recommended by International Obesity Task Force (IOTF) 14 . B.M.I. < 18.5 Kg/m2 belonged to Underweight category, B.M.I. between 18.5 Kg/m2 and 22.9 Kg/m2 were counted in Normal category, B.M.I. ranged between 23.0 Kg/m2 and 24.9 Kg/m2 were considered Overweight/Pre-obese, B.M.I. from 25 Kg/m2 to 29.9 Kg/m2 were of Obesity class I, B.M.I. of ≥ 30.0 Kg/m2 were appointed to the Obesity class II category.
Data was collected using the short form of the International Physical Activity Questionnaire (IPAQ). WHO recommends the IPAQ for assessing people aged between 15-69 years for physical activity 15 , 16 . The study tool consists of questions related to duration, intensity, and frequency of physical activity in leisure time, transport, and domestic as well as time spent in sitting. Individuals can be classified as mild, moderate, and vigorous according to the score found. Physical activity was used as the dependent variable, and variables like age, gender, height (cm), weight (kg), and B.M.I. were independent. Anthropometric measurements of height and weight were recorded for each participant.
Participants were stratified into groups of low, moderate, or high physical activity on the bases of the M.E.T. criteria below: M.E.T. of 3.3, 4, and 8 for walking, moderate, and vigorous physical activity, respectively.
If the M.E.T. score is less than 600, it will be considered low or mildly active or inactive.
If the M.E.T. score is between 600 and 3000, it will be included in the category of moderate activity.
Those who score a M.E.T. level of more than 3000 have high activity.
DATA ANALYSIS
We used the 25 th version of IBM-SPSS, and data were analyzed using descriptive and bivariate methods. The descriptive method was used to find the percentage (%) and frequency (n) of mild, moderate, and vigorous physical activity levels and B.M.I. variable. Chi-square test was applied to find the significant association among leisure, transport, domestic domain of physical activity, and applied on sitting minutes, B.M.I., and different university departments. The significance level was fixed, which is α = 0.05. If the P-value was less than 0.05 is considered significant 17 . We used independent samples t-tests to compare the means for age (years), weight (kg), Height (cm), and B.M.I. (kg/m²) variable based on their gender difference to find means of leisure, transport, and domestic domains of physical activity and also applied on sitting minutes. Pearson's test was used to find the correlation among the scale variable: B.M.I., METS of physical activity and sitting minutes per week.
RESULT
Out of 377 participants, almost 2/3 constituted of male n = 243 (64.5%), and 1/3 were female n = 134 (35.5%). The mean age, weight, height, and B.M.I. of the sample was 20.93 ± 1.43, 62.38 ± 12.72, 166.68 ± 9.41, and 22.47 ± 4.44, respectively. The gender-wise mean of the anthropometric measures is shown in Table 1 .
The level of physical activity in different domains was calculated gender-wise. In the leisure physical activity domain, the majority of male and female participants were moderately active N = 110 (45.26%), N = 59 (44.02%), respectively. In the second domain of transport, male participants were mostly moderately active N = 115 (47.32%), and female participants were more dominant in mild activities N = 64 (47.76%). In the domestic domain, male participants were overall more active than female in all physical activities ( Table 2 ).
The result was calculated for several participants that perform leisure activities with different intensity. A total of N = 103 (27.3%), N = 169 (44.8%), N = 71 (18.8), and N = 34 (9%) students performed leisure activities with mild, moderate-vigorous intensity, and inactivity, respectively. Transport domain includes N = 125 (33.16%), N = 171(45.4%), N = 55 (14.6%) N = 26 (6.9%) number of students performed mild, moderate, vigorous-intensity activity and inactivity, respectively. The domestic domain includes N = 86 (22.8%), N = 127 (33.7%), N = 69 (18.3%), and N = 95 (25.2%) number of students performed mild, moderate, vigorous-intensity activity and inactivity, respectively as shown in Figure 1 .
Figure 1 .

Means scores of the M.E.T.s were calculated in different domains of IPAQ. Total mean ± SD score for leisure, transport and domestic domains were calculated 1638.29 ± 1708.20 (P-value = .000), 1502.7 ± 1745.73 (P-value = .000) and 1662.26 ± 2564.79 (P-value = .000), respectively. By combining the individual domain scores, the total domain score was found. The mean score of the total physical activity was calculated to be 4803.33 ± 4117.4 (P-value = .000). Gender wise means ± S.D. of different physical activity domains, as shown in ( Table 3 ).
The sitting domain was also calculated to determine how much time the participants spent sitting throughout a week. The total mean score of all participants sitting per week 2810.98 ± 1538.04 (P-value = .065). Gender wise mean value of male and female participants for sitting per week was 2535.20 ± 1431.05 and 3311.08 ± 1603.26, respectively. Transportation sitting minutes were also calculated; the mean measured was 388.74 ± 468.11 (P-value = .011) ( Table 4 ).
The result was calculated to find out the study year and the number of students who took part in physical activity. The result shows that most students performed physical activity with moderate intensity, which was followed by the mild intensity and vigorous activity ( Table 5 ).
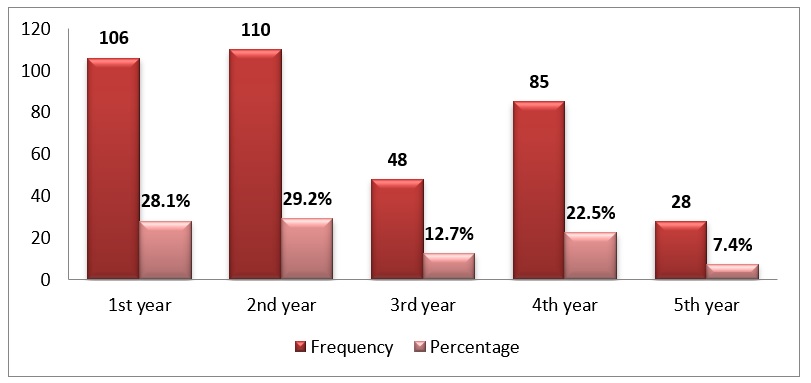
Participants were divided by their year of study, i.e. , from 1 st year to 5 th year. Most of the students from the sample were from 2 nd year, 1 st year, 4 th year, 3 rd year, and 5 th year with N = 110 (29.2%), N = 106 (28.1%), N = 85 (22.5%), N = 48 (12.7%), and N=28 (7.4%), respectively ( Figure 2 and Table 5 ).
Out of all the participants, normal B.M.I. prevailed the most with N = 246 (65.3%) out of which N = 154 (40.9%) were male and N = 92 (24.4%) were female participants. The underweight and overweight categories had the same number of participants , i.e ., N = 53 (14.1%) each, but gender-wise distribution was different. Obese Class I accounted for total N = 24 (6.4%) with N = 18 (%) were male, and N = 6 (%) were female participants and Obese Class II comprised of total N = 1 (0.3%) participant who was only one female N=1 (0.3%) as shown in Figure 3 and Table 6 .

The correlation was interpreted between B.M.I. and the domains of the physical activity as well as sitting ( Table 7 ). We selected eight departments through convenience sampling from the University of Peshawar. Which include computer science N = 59 (15.6%), pharmacy N = 86 (22.8%), maths N = 36 (9.5%), physics N = 27 (7.2%), chemistry N = 43 (11.4%), law N = 47 (12.5%), English N = 46 (12.2%) and psychology N = 33 (8.8%).
DISCUSSION
This research was conducted to find the level of physical activity in the undergraduate students of Peshawar University. Physical activity level was measured by using the International Physical Activity Questionnaire (IPAQ) short form. It is a valid and reliable tool for finding out the individual's physical activity status 18 . It is used worldwide and is known for detailed assessment in all domains of physical activities such as transport, leisure, domestic, and sitting time.
Our research study contained few limitations, such as the study was limited to the University of Peshawar only and comprised of 243 (64.5%) male and 134 (35.5%) female students. The current study is a cross-sectional study conducted using a questionnaire. It showed that males were predominantly more active than females. Same findings were present in a study done in Romania, which showed that as compared to males, the female students were less active and did not take part in vigorous intense activities 19 .
A study was performed in Brazil at a university; similar findings were reported; female students were physically inactive as compared to males. It was also found that males were dominant in being physically active in the domains of leisure activities and transportation, but the female students were more physically active in the domain of domestic activities only 16 .
Our results were in contradiction to a study conducted in the U.S.A., where a large number of students took part in physical activities at different intensities. This result was quite different from our results, probably because the students belonged to the department of nursing, health sciences and were known more for the needs that lead to physically active lifestyles 20 .
In India, a study was conducted at university level students, and it was found that the majority of the participants performed physical activity at a moderate level and while male students were more active in vigorous activities, the female students were engaged only in walking 9 .
A study from Malaysia regarding the physical activity level in students concluded that more than half of the participants performed moderately in intense activities, overall there was no in a change in the prevalence of physical inactivity 1 .
In our study, we crossed B.M.I. and the domains of physical activity based on gender. It was evident that the level of physical activity decreased as B.M.I. fluctuated from normal to over-weight; underweight or obese in both the genders, but the overall score of male participants was more, showing that there is a strong association of B.M.I. and levels of physical activity. A relevant result was seen in India's study, which shows that B.M.I. and Gender are notably linked with changes in physical activity levels. However, in some studies, females were also highly active and even active than males. Environmental conditions and health-improving facilities are diverse in Asia from Europe; this could be a possible reason for higher female activity in Europe than in Asia.
A study was done in Poland, which showed that males were more active in the walking domain, while female students were more physically active than male students in all other remaining domains, which is different from our study's findings 21 . In Australia's research, it was reported that both genders demonstrated the same level of physical activity 22 . Female students mostly belonged to physical activity at low levels. Also, in the context of B.M.I., participants who were obese or belonged to Obese Classes demonstrated a lack of physical activity 23 .
CONCLUSION
From our study, the conclusion we made is that B.M.I. and Physical Activity are negatively associated with each other. Based on gender, the male students were more physically active than the female. A larger part of the sample participated in moderate physical activities rather than mild and vigorous physical activity. Females have more sitting minutes per week than males. More than half of the participants have normal B.M.I. A few respondents were physically inactive, which shows that there is still unawareness of physical activity on the university level.
FUTURE PROSPECTIVE
The current study is a cross-sectional study conducted with a questionnaire, which should be followed by a detailed evaluation and subjective assessment in the future. This study is deprived of an analytical or experimental study on each and every variable, which is strongly recommended being considered in a future study.
Competing interests
The authors declare that they have no competing interests.
References
- Goje M., Salmiah M.S., Ahmad A.A., Jusoff K.. Physical inactivity and its associated factors among university students. IOSR Journal of Dental and Medical Sciences. . 2014;13:119-130. View Article Google Scholar
- Sinclair K.M., Hamlin M.J., Steel G.. Physical activity levels of first-year New Zealand university students: a pilot study. Youth Studies Australia. . 2005;24:38. Google Scholar
- WHO. Rheumatic fever and rheumatic heart disease: report of a WHO Expert Consultation, Geneva, 29 October-1 November, 2001, Vol 923 (World Health Organization). . 2004;:. Google Scholar
- Strong W.B.. Evidence based physical activity for school-age youth. The Journal of pediatrics. . 2005;146:732-737. View Article PubMed Google Scholar
- WHO. The world health report 2002: reducing risks, promoting healthy life (World Health Organization). . 2002;:. Google Scholar
- Spring B., King A.C., Pagoto S.L., Van H.L., Fisher J.D.. Fostering multiple healthy lifestyle behaviors for primary prevention of cancer. American Psychologist. 70. 2015;75:. View Article PubMed Google Scholar
- Theodorakis Y.. Correlation between exercise and other health related behaviors in Greek students. International Journal of Physical Education. . 2002;39:30-34. Google Scholar
- Singh H.. A cross-sectional assessment of domain-specific physical activity among university students. IJAR. . 2017;3:20-22. Google Scholar
- Singh H., Singh S.. Prevalence, patterns and associated factors of Physical Activity in Indian University students. European Journal of Physical Education and Sport Science. . 2017;:. Google Scholar
- Janssen I., LeBlanc A.G.. Systematic review of the health benefits of physical activity and fitness in school-aged children and youth. International journal of behavioral nutrition and physical activity. . 2010;7:40. View Article PubMed Google Scholar
- Lavie C.J.. Exercise training and cardiac rehabilitation in primary and secondary prevention of coronary heart disease. Paper presented at: Mayo Clinic Proceedings (Elsevier). . 2009;:. View Article PubMed Google Scholar
- Vuori I.. Physical inactivity is a cause and physical activity is a remedy for major public health problems. Kinesiology. . 2004;36:123-153. Google Scholar
- WHO. World health statistics 2010 (World Health Organization). . 2010;:. Google Scholar
- WHO. The Asia-Pacific perspective: redefining obesity and its treatment (Sydney: Health Communications Australia). . 2000;:. Google Scholar
- WHO. Interventions on diet and physical activity: what works: methodology. . 2009;:. Google Scholar
- Pires C.G.D.S.. Physical activity practice among undergraduate students in nursing. Acta Paulista de Enfermagem. . 2013;26:436-443. View Article Google Scholar
- Lee I.M., Skerrett P.J.. Physical activity and all-cause mortality: what is the dose-response relation? Medicine and science in sports and exercise. . 2001;33:S459-S471. View Article PubMed Google Scholar
- Craig C.L.. International physical activity questionnaire: 12-country reliability and validity. Medicine & science in sports & exercise. . 2003;35:1381-1395. View Article PubMed Google Scholar
- Fagaras S.P., Radu L.E., Vanvu G.. The level of physical activity of university students. Procedia-Social and Behavioral Sciences. , -.. 2015;197:1454-1457. View Article Google Scholar
- Simiyu W.W.N., Njororai F.J.. College undergraduate students' self-rating of their physical activity involvement over a 7-day period. . 2015;:. Google Scholar
- Pastuszak A., Lisowski K., Lewandowska J., Buśko K.. Level of physical activity of physical education students according to criteria of the IPAQ questionnaire and the recommendation of WHO experts. Biomedical Human Kinetics 6. . 2014;:. View Article Google Scholar
- Pedišić Ž, Rakovac M, Bennie J, Jurakić D, and Bauman AE. Levels and correlates of domain-specific physical activity in university students: Cross-sectional findings from Croatia. Kinesiology: International journal of fundamental and applied kinesiology. . 2014;46:12-22. Google Scholar
- Rajappan R., Selvaganapathy K., Liew L.. Physical activity level among university students: a cross-sectional survey. Int J Physiother Res. . 2015;3:1336-1343. View Article Google Scholar


Percentage of physical activity in different domains and total physical activity.